Answered step by step
Verified Expert Solution
Question
1 Approved Answer
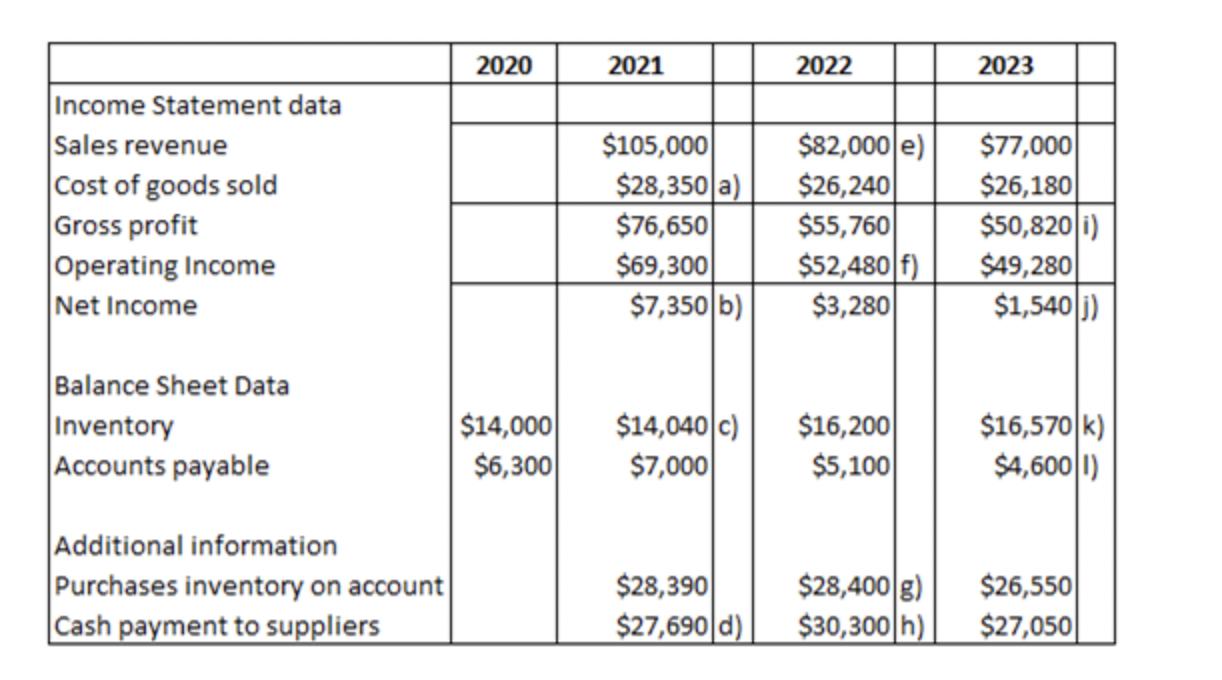
Compute the gross profit rate and the profit margin for each fiscal year. (Round answers to 1 decimal place, e.g. 15.5%) Gross profit rate


Compute the gross profit rate and the profit margin for each fiscal year. (Round answers to 1 decimal place, e.g. 15.5%) Gross profit rate Profit margin 2021 % % 2022 % % 2023 % % 2020 2021 2022 2023 Income Statement data Sales revenue Cost of goods sold Gross profit Operating Income Net Income $105,000 $82,000 e) $77,000 $28,350 a) $26,240 $26,180 $76,650 $55,760 $50,820 i) $69,300 $52,480 f) $49,280 $7,350 b) $3,280 $1,540 j) Balance Sheet Data Inventory $14,000 $14,040 c) $16,200 $16,570 k) Accounts payable $6,300 $7,000 $5,100 $4,600 1) Additional information Purchases inventory on account $28,390 $28,400 g) $26,550 Cash payment to suppliers $27,690 d) $30,300 h) $27,050
Step by Step Solution
There are 3 Steps involved in it
Step: 1

Get Instant Access to Expert-Tailored Solutions
See step-by-step solutions with expert insights and AI powered tools for academic success
Step: 2

Step: 3

Ace Your Homework with AI
Get the answers you need in no time with our AI-driven, step-by-step assistance
Get Started


