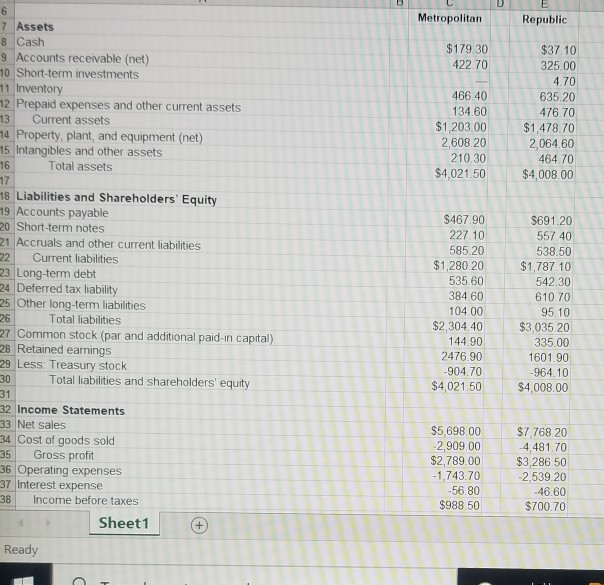
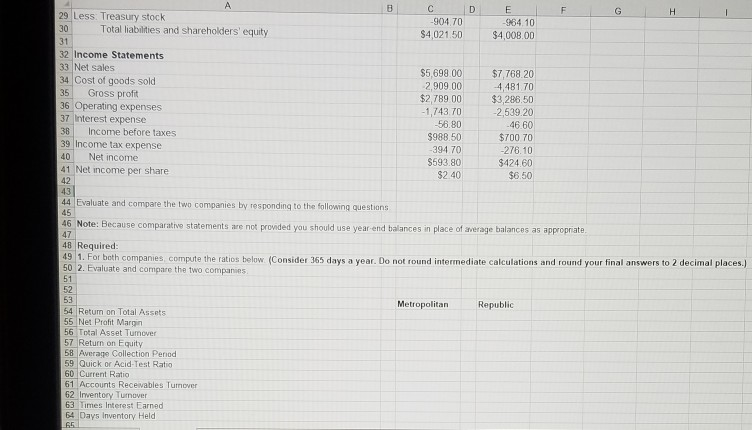
Compute the ratios listed at the bottom of the spreadsheet for both companies. (You should use a 365 day year, not the 360 day year used in finance. Do not round intermediate calculations and round your final answer to 2 decimal places.) You can find the ratios, how to compute them and what they mean your textbook and Appendix A in your textbook.
Evaluate and compare the two companies by responding to the following questions.
For each ratio calculated determine which company ratio is better?
Describe why each of the ratios chosen in (a) are better?
For each ratio, identify at least two things the companies could do to improve their ratios.


Metropolitan Republic $179.30 422.70 466 40 134.60 $1.203.00 2,608.20 210.30 $4,021.50 $37.10 325 00 4.70 635 20 476.70 $1.478.70 2,064.60 464 70 $4,008,00 6 7 Assets 8 Cash 9 Accounts receivable (net) 10 Short-term investments 11 Inventory 12 Prepaid expenses and other current assets 13 Current assets 44 Property, plant, and equipment (net) 15 Intangibles and other assets 16 Total assets 17 18 Liabilities and Shareholders' Equity 19 Accounts payable 20 Short-term notes 21 Accruals and other current liabilities 22 Current liabilities 23 Long-term debt 24 Deferred tax liability 25 Other long-term liabilities 26 Total liabilities 27 Common stock (par and additional paid-in capital) 28 Retained earnings 29 Less: Treasury stock 30 Total liabilities and shareholders' equity 31 32 Income Statements 33 Net sales 34 Cost of goods sold 35 Gross profit 36 Operating expenses 37 Interest expense 38 Income before taxes Sheet1 $467.90 227.10 585.20 $1,280.20 535.60 384.60 104 00 $2,304.40 144.90 2476.90 -904.70 $4,021.50 $691.20 557.40 538.50 $1,787.10 542.30 610.70 95.10 $3,035 20 335.00 1601.90 -964.10 $4,008.00 $5,698 00 2,909.00 $2,789.00 -1,743.70 -56.80 $988.50 $7 768 20 -4,481 70 $3,286.50 -2,539 20 -46.60 $700.70 Ready D A B E F G H 29 Less: Treasury stock -90470 -964.10 30 Total liabilities and shareholders' equity $4,021.50 $4,000.00 31 32 Income Statements 33 Net sales $5.698.00 $7,768.20 34 Cost of goods sold 2,909.00 4,481 70 35 Gross profit $2,789 00 $3,286,50 36 Operating expenses -1,743.70 -2,539,20 37 Interest expense -56.80 -46.60 38 Income before taxes $988.50 $700 70 39 Income tax expense -394 70 -276.10 40 Net income $593.80 $424.60 41 Net income per share $2.40 $6.50 42 43 44 Evaluate and compare the two companies by responding to the following questions 45 46 Note: Because comparative statements are not provided you should use year-end balances in place of average balances as appropriate 47 48 Required: 49 1. For both companies compute the ratios below (Consider 365 days a year. Do not found intermediate calculations and round your final answers to 2 decimal places.) 50 2. Evaluate and compare the two companies 51 52 53 Metropolitan Republic 54 Return on Total Assets 55 Net Profit Margin 56 Total Asset Tumover 57 Return on Equity 58 Average Collection Penod 59 Quick or Acid-Test Ratio 60 Current Ratio 61 Accounts Recewables Turnover 62 Inventory Turnover 63 Limes Interest Earned B4 Days Inventory Held 65


