

Answered step by step
Verified Expert Solution
Question
1 Approved Answer
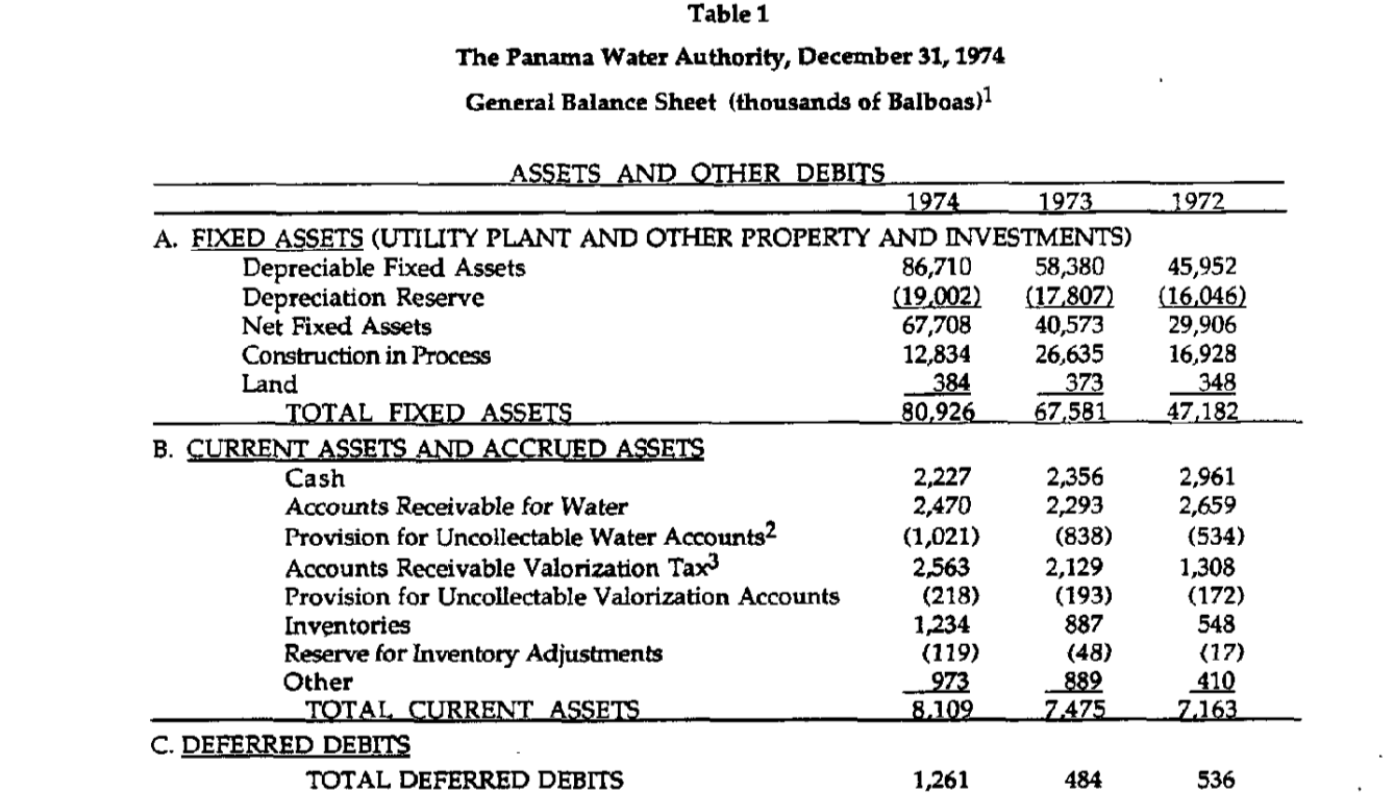
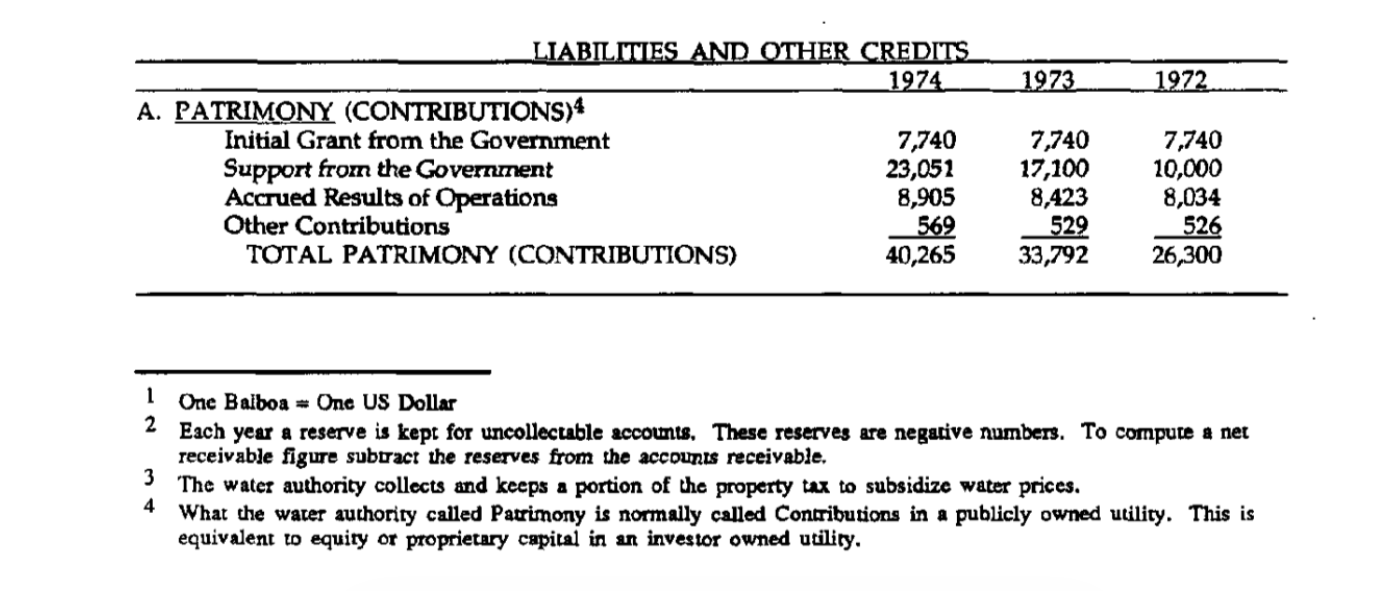
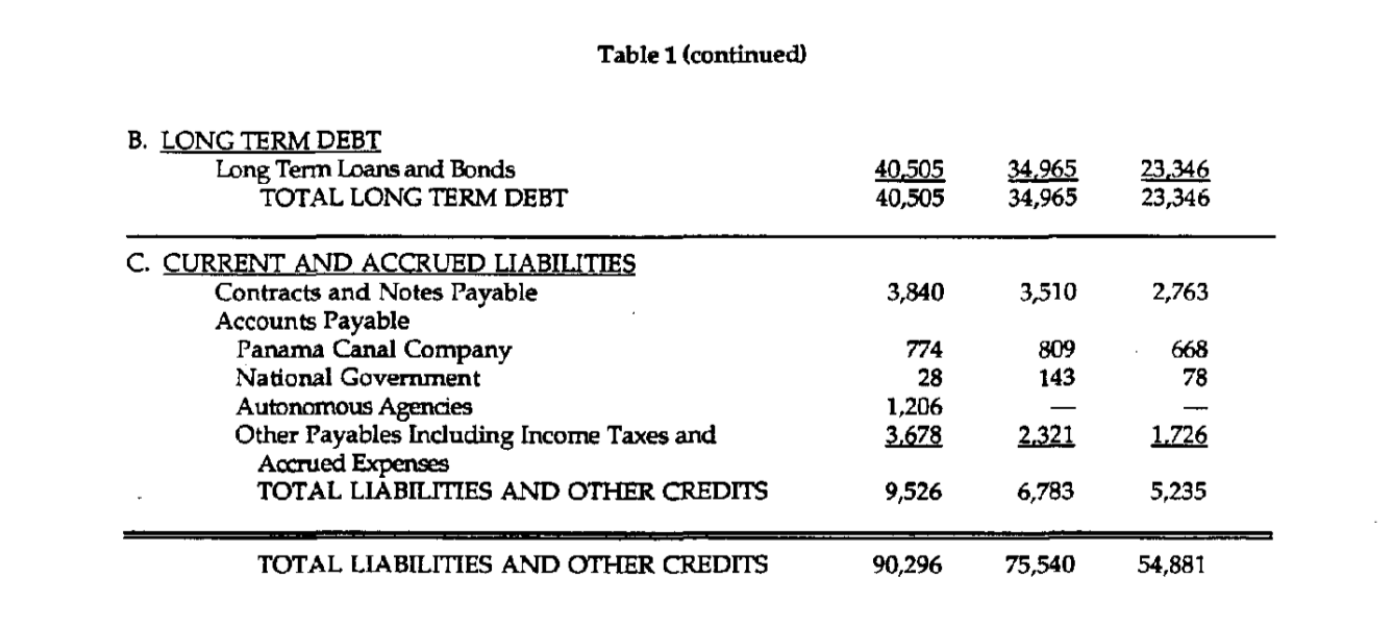
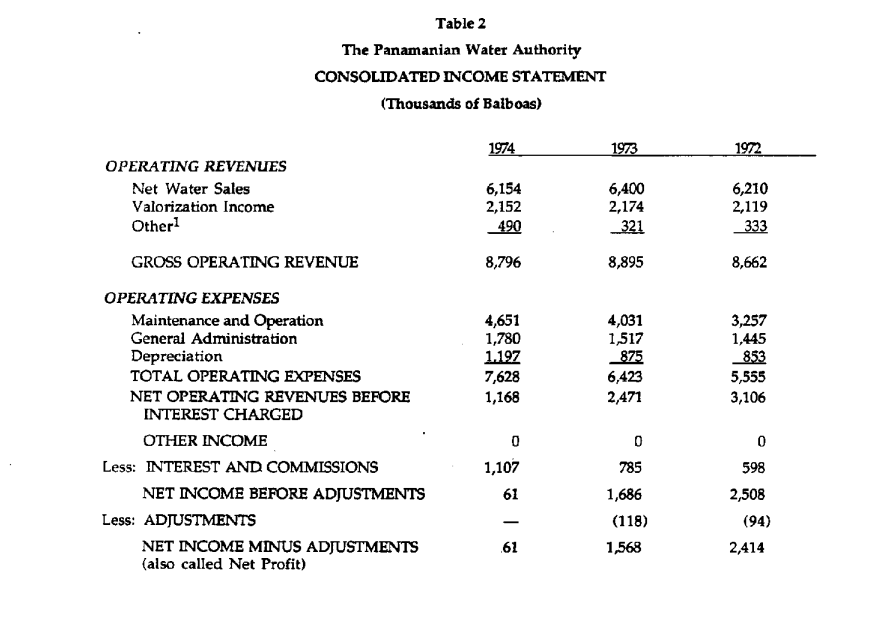
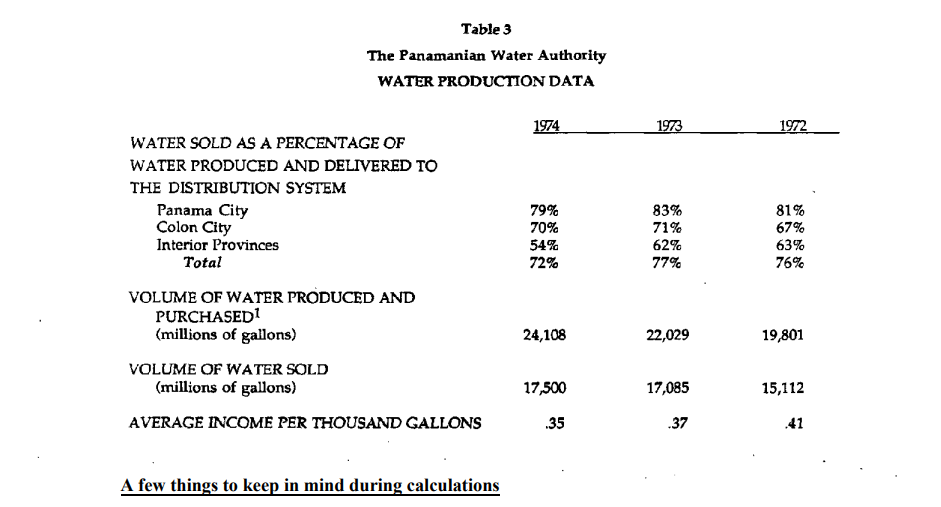
Compute the ratios listed in Table A using the balance sheet and income statements (Tables 1 and 2) and the production data (Table 3). Please
Compute the ratios listed in Table A using the balance sheet and income statements (Tables 1 and 2) and the production data (Table 3).
Please fill the below worksheet.
| MEASURES AND RATIOS | 1974 | 1973 | 1972 | |
| I. | LIQUIDITY | |||
| a. | Current Ratio Current Assets / Current Liabilities | |||
| b. | Quick Ratio Current Assets - Inventories / Current Liabilities | |||
| c. | Average Collection Period in Days (Water) [Net Water Receivables (receivables-uncollectable accounts)]/ Net Water Sales] X 365 Days | |||
| d. | Average Collection Period in Days (Valor.) [Net Valor. Receivables (receivables-uncollectable accounts) / Valorization Income from Table 2] X 365 Days | |||
| e. | Total Assets Turnover Gross Operating Revenues / Total Assets (Total Assets is sum of total fixed assets and total current assets) | |||
| II. | SOLVENCY | |||
| a. | Long Term Debt to Capitalization (Percentage) Long Term Debt / (Long Term Debt + Patrimony) (Percentage) | |||
| b. | Total Debt (Long Term Debt+Total Current and Accrued Liabilities) (Percentage) / Total Liabilities abd Other Credits (Percentage) | |||
| c. | Times Interest Earned Ratio Net Operating Revenues before Interest / Interest Charges and Commissions | |||
Step by Step Solution
There are 3 Steps involved in it
Step: 1

Get Instant Access to Expert-Tailored Solutions
See step-by-step solutions with expert insights and AI powered tools for academic success
Step: 2

Step: 3
Ace Your Homework with AI
Get the answers you need in no time with our AI-driven, step-by-step assistance
Get Started
Glencoe Accounting Real World Applications And Connections Advanced Course Audit Tests
Authors: McGraw-Hill
5th Edition
0078462002, 978-0078462009