

Answered step by step
Verified Expert Solution
Question
1 Approved Answer
Compute the weekly percent return on a portfolio composed of 20% AMZN, 40% MCK, and 40% KR Compute the average weekly (percent) return of the
| Compute the weekly percent return on a portfolio composed of 20% AMZN, 40% MCK, and 40% KR | ||||||||||
| Compute the average weekly (percent) return of the AMZN-MCK-KR portfolio | ||||||||||
| Compute the standard deviation of weekly (percent) returns for the AMZN-MCK-KR portfolio (HINT: start with the portfolio returns rather than the returns of the components) | ||||||||||
| What do you notice about the standard deviation of the portfolio compared to the individual stocks? What does this tell us about the risk of the portfolio compared to the risk of the individual stocks? | 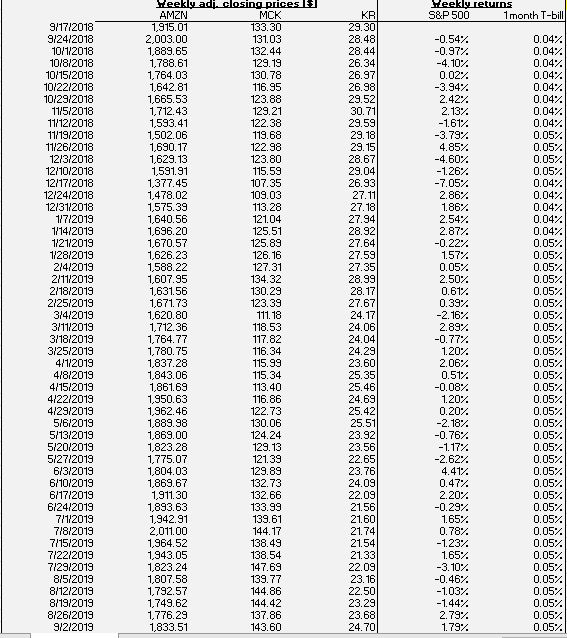 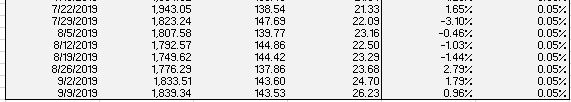 | |||||||||
show the formulas you use please! you don't have to do it all but at least show me the formulas
edit: the periods are weekly
Weekly returns S&P 500 1 month T-bill 9/17/2018 S/24/2018 10/1/201 10/8/2018 10/15/2018 10/22/2018 10/29/201 11/5/201 11/12/2018 11/19/2018 11/26/2018 12l3/201E 12/10/2018 12/17/2018 12/24/2016 12/31/201 17/2018 1/1/2018 1/21/2015 1/28/2018 2l4/2019 2/11/2015 2/18/2019 2/25/2018 3/4/2018 3/11/2015 3/18/2019 3/25/2018 4/1/2018 4{}{2018 4/15/2015 4/22/2015 4/29/2018 5/6/2015 5/13/2015 5/20/2018 5/27/2018 6/3/2018 6/10/2015 6/17/2018 6/24/2019 }{1/2018 7/8/2019 7/15/2013 7/22/2018 7/29/2018 8/5/2018 8/12/2015 8/19/2018 8/26/2015 s/2/2018 Weekly adj. closing prices AMZN VICK.. 1,515 01 13330 2.003.00 131,03 15.65 132.44 1.7 .1 12. 19 1,7E4.3 130. TE 1,421, 116.35 1,665,53 123.88 1,71243 129.21 1,533.41 1223 1, 52.6 115. 1,690.17 122.8 1,629,13 123.] 1,51.1 115.58 1,371.45 107.35 147 02 109.03 1,575.39 13.2 1,540.56 12104 1,66.20 125,51 1,67057 125. 1,626.23 126.16 1,5E.22 127.31 1.507.55 14.32 1,631.56 130.23 1,671.73 123,39 1,520, 111.1E 1,712.36 11.53 1,764.77 11.2 1,70.75 116,34 1.3.2 1153 1,43.06 115.34 1,61. 113.40 1,350,63 116.6 1.362.46 122,73 15. 13.pE 1,8690 124.24 1,823.2 12.13 1,7757 121,39 14.03 123. 1,65.67 132.73 1111.30 132,66 1,853.63 133. 192.11 13.61 211.00 144.17 1.364.52 138,49 1,543.05 13.54 1,823 24 147. 1,07.5 139.77 1,732 57 144,86 1,745,62 144,42 1,776.23 137,BE 1,3351 143.50 -0.54 -0.17 -4.1] .2 -3.54 2.42: 2:13. -1.61 -3.73 4.5 -4.50 -126 -7.05: 2.86? 1.6 2.54? 2.71 -0.22 157 0.05 2.50 .612 .33? -2.16 2.88? -0.77 1.20 2.06? 0.512 -0.08 1.2] 0.20. -218 -0.76 -1.17 -2.62 4.41 |],47 2:20 -0.29 1.65 0.78. -1.23 1.65 -31 -].46 -103 -1.44? 2.79? 1.75 004| .4 .04 .4 ,04| .4 .04 .4 .5? .-? .5? .-? 0.04 4? .04 .4 | .04 ,05 .-? .5 05 0.05: 05 .5 .-? .5 05 .5 05 0.05: 05 .5 05 0.05: 05 .5 05 0.05: 05 .5 05 0.05: .05 .5 .5 .5 ,05 .5 05 0.5 | 5: 7/22/2018 7/28/2018 8/5/2018 8/12/2018 {1/2018 {25/2018 s/2/2018 3/9/2013 1,543.05 1,23.24 1,07.58 1,792.57 1,7492 1,176.29 1,3351 1,833 34 13.54 147,69 139.77 144,86 144,42 137.56 143.50 143,53 1.65 -3.10 -0.46: -1,03 -1.44 278 1.78 0.05: .15 .5 .5 .5 .15 .05: Weekly returns S&P 500 1 month T-bill 9/17/2018 S/24/2018 10/1/201 10/8/2018 10/15/2018 10/22/2018 10/29/201 11/5/201 11/12/2018 11/19/2018 11/26/2018 12l3/201E 12/10/2018 12/17/2018 12/24/2016 12/31/201 17/2018 1/1/2018 1/21/2015 1/28/2018 2l4/2019 2/11/2015 2/18/2019 2/25/2018 3/4/2018 3/11/2015 3/18/2019 3/25/2018 4/1/2018 4{}{2018 4/15/2015 4/22/2015 4/29/2018 5/6/2015 5/13/2015 5/20/2018 5/27/2018 6/3/2018 6/10/2015 6/17/2018 6/24/2019 }{1/2018 7/8/2019 7/15/2013 7/22/2018 7/29/2018 8/5/2018 8/12/2015 8/19/2018 8/26/2015 s/2/2018 Weekly adj. closing prices AMZN VICK.. 1,515 01 13330 2.003.00 131,03 15.65 132.44 1.7 .1 12. 19 1,7E4.3 130. TE 1,421, 116.35 1,665,53 123.88 1,71243 129.21 1,533.41 1223 1, 52.6 115. 1,690.17 122.8 1,629,13 123.] 1,51.1 115.58 1,371.45 107.35 147 02 109.03 1,575.39 13.2 1,540.56 12104 1,66.20 125,51 1,67057 125. 1,626.23 126.16 1,5E.22 127.31 1.507.55 14.32 1,631.56 130.23 1,671.73 123,39 1,520, 111.1E 1,712.36 11.53 1,764.77 11.2 1,70.75 116,34 1.3.2 1153 1,43.06 115.34 1,61. 113.40 1,350,63 116.6 1.362.46 122,73 15. 13.pE 1,8690 124.24 1,823.2 12.13 1,7757 121,39 14.03 123. 1,65.67 132.73 1111.30 132,66 1,853.63 133. 192.11 13.61 211.00 144.17 1.364.52 138,49 1,543.05 13.54 1,823 24 147. 1,07.5 139.77 1,732 57 144,86 1,745,62 144,42 1,776.23 137,BE 1,3351 143.50 -0.54 -0.17 -4.1] .2 -3.54 2.42: 2:13. -1.61 -3.73 4.5 -4.50 -126 -7.05: 2.86? 1.6 2.54? 2.71 -0.22 157 0.05 2.50 .612 .33? -2.16 2.88? -0.77 1.20 2.06? 0.512 -0.08 1.2] 0.20. -218 -0.76 -1.17 -2.62 4.41 |],47 2:20 -0.29 1.65 0.78. -1.23 1.65 -31 -].46 -103 -1.44? 2.79? 1.75 004| .4 .04 .4 ,04| .4 .04 .4 .5? .-? .5? .-? 0.04 4? .04 .4 | .04 ,05 .-? .5 05 0.05: 05 .5 .-? .5 05 .5 05 0.05: 05 .5 05 0.05: 05 .5 05 0.05: 05 .5 05 0.05: .05 .5 .5 .5 ,05 .5 05 0.5 | 5: 7/22/2018 7/28/2018 8/5/2018 8/12/2018 {1/2018 {25/2018 s/2/2018 3/9/2013 1,543.05 1,23.24 1,07.58 1,792.57 1,7492 1,176.29 1,3351 1,833 34 13.54 147,69 139.77 144,86 144,42 137.56 143.50 143,53 1.65 -3.10 -0.46: -1,03 -1.44 278 1.78 0.05: .15 .5 .5 .5 .15 .05Step by Step Solution
There are 3 Steps involved in it
Step: 1

Get Instant Access to Expert-Tailored Solutions
See step-by-step solutions with expert insights and AI powered tools for academic success
Step: 2

Step: 3
Ace Your Homework with AI
Get the answers you need in no time with our AI-driven, step-by-step assistance
Get Started
Crypto Asset Investing In The Age Of Autonomy
Authors: Jake Ryan
1st Edition
1119705363, 978-1119705369