Answered step by step
Verified Expert Solution
Link Copied!

Question

1 Approved Answer

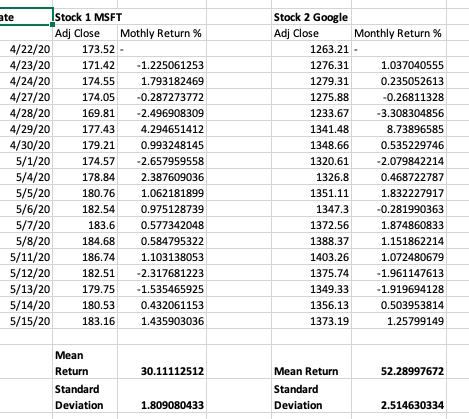
compute two portfolio returns and portfolio variances. Use the formula: portfolio return: E(R P ) = w * r T portfolio variance: P2 =ww T

compute two portfolio returns and portfolio variances.

Use the formula: portfolio return: E(RP) = w * rT

portfolio variance: P2 =wwT image text in transcribedimage text in transcribed

Stock 1 Stock 2 Apple Inc. (AAPL) PepsiCo, Inc. (PEP) Date Adj Close Monthly Return (%) Adj Close Monthly Return (%) 01-05-2019 172.341583 124.479256 01-06-2019 195.58577 13.49% 127.523163 2.45% 01-07-2019 210.527466 7.64% 125.204521 -1.82% 01-08-2019 206.278168 -2.02% 133.942688 6.98% 01-09-2019 222.169479 7.70% 134.305145 0.27% 01-10-2019 246.760193 11.07% 135.302307 0.74% 01-11-2019 265.101563 7.43% 133.98056 -0.98% 01-12-2019 292.163818 10.21% 134.809113 0.62% 01-01-2020 307.943604 5.40% 141.06749 4.64% 01-02-2020 271.976532 -11.68% 131.144485 -7.03% 01-03-2020 253.6035 -6.76% 119.294495 -9.04% 01-04-2020 293.006836 15.54% 132.289993 10.89% 01-05-2020 309.292755 5.56% 134.229996 1.47% Average Return =Average(Returns) =Average(Returns) 5.30% 0.77% Standard Deviation ESTDEV.P(Returns) =STDEV.P(Returns) 7.81% 5.22% ate Stock 1 MSFT Adj Close Mothly Return% 4/22/20 173.52 - 4/23/20 171.42 -1.225061253 4/24/20 174.55 1.793182469 4/27/20 174.05 -0.287273772 4/28/20 169.81 -2.496908309 4/29/20 177.43 4.294651412 4/30/20 179.21 0.993248145 5/1/20 174.57 -2.657959558 5/4/20 178.84 2.387609036 5/5/20 180.76 1.062181899 5/6/20 182.54 0.975128739 5/7/20 183.6 0.577342048 5/8/20 184.68 0.584795322 5/11/20 186.74 1.103138053 5/12/20 182.51 -2.317681223 5/13/20 179.75 -1.535465925 5/14/20 180.53 0.432061153 5/15/20 183.16 1.435903036 Stock 2 Google Adj Close Monthly Return % 1263.21 - 1276.31 1.037040555 1279.31 0.235052613 1275.88 -0.26811328 1233.67 -3.308304856 1341.48 8.73896585 1348.66 0.535229746 1320.61 -2.079842214 1326.8 0.468722787 1351.11 1.832227917 1347.3 -0.281990363 1372.56 1.874860833 1388.37 1.151862214 1403.26 1.072480679 1375.74 -1.961147613 1349.33 -1.919694128 1356.13 0.503953814 1373.19 1.25799149 Mean Return 30.11112512 52.28997672 Standard Deviation Mean Return Standard Deviation 1.809080433 2.514630334

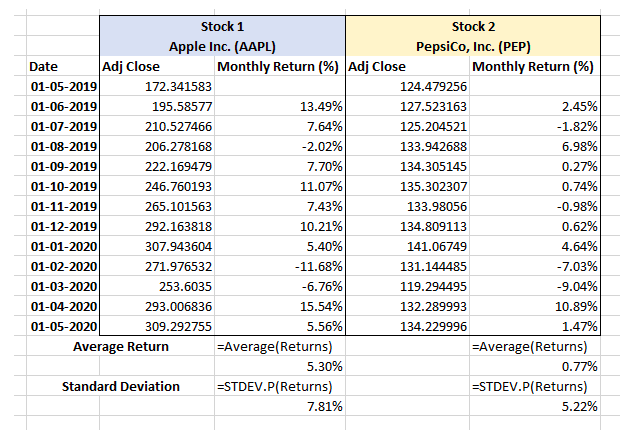
Step by Step Solution

There are 3 Steps involved in it

Step: 1

blur-text-image

Get Instant Access to Expert-Tailored Solutions

See step-by-step solutions with expert insights and AI powered tools for academic success

Step: 2

blur-text-image

Step: 3

blur-text-image

Ace Your Homework with AI

Get the answers you need in no time with our AI-driven, step-by-step assistance

Get Started

Recommended Textbook for

Modern Portfolio Theory and Investment Analysis

Authors: Edwin Elton, Martin Gruber, Stephen Brown, William Goetzmann

9th edition

9781118805800, 1118469941, 1118805801, 978-1118469941

More Books

Students also viewed these Finance questions