

Question: COMPUTER NETWORKS. EASY QUESTIONS a) Why are the two charts so different? Explain! Hint: You should pay attention both at the shapes of the two
COMPUTER NETWORKS. EASY QUESTIONS
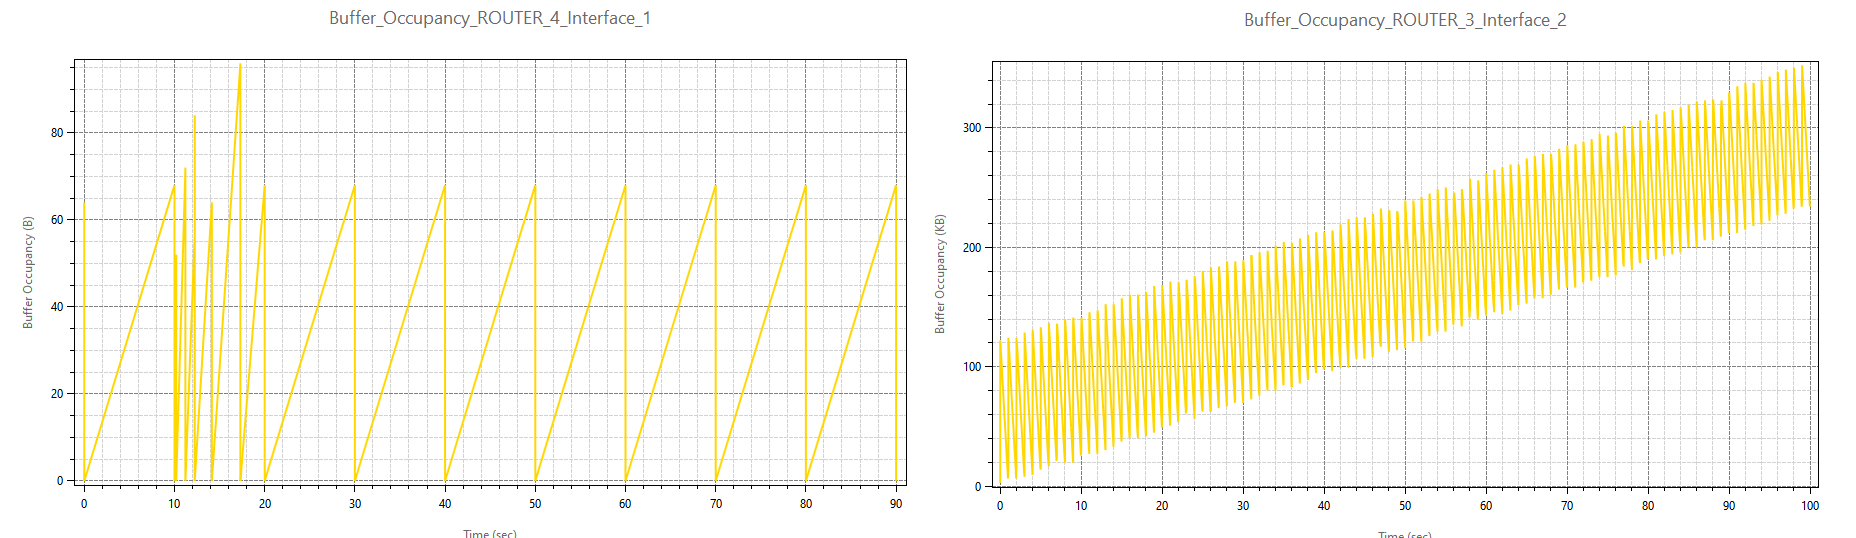
a) Why are the two charts so different? Explain!
Hint: You should pay attention both at the shapes of the two graphs as well as the values along the y-axis!
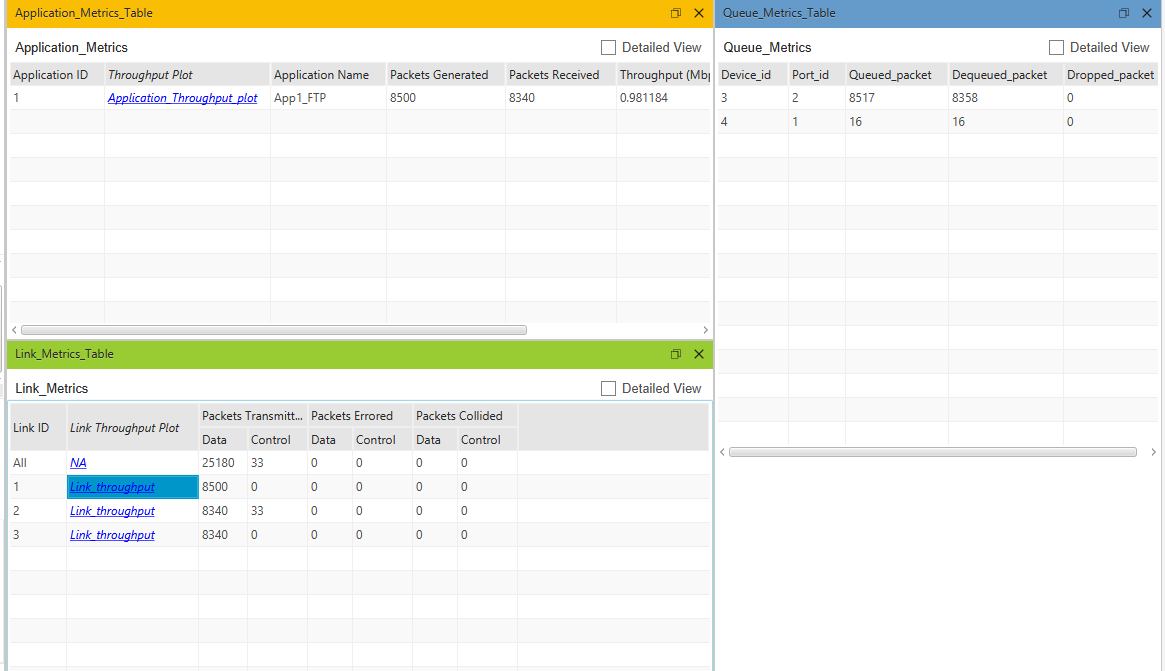
b) How are the shapes (trends) of the two charts related to the respective Queued_packet values in Queue_Metrics_Table section of the Simulation Results panel? Explain!
Hint: Queued_packet value represents the total number of packets that have been queued in the buffer of the respective router in the course of the given simulation. A packet is queued if it cannot be immediately transmitted.
c) What are the number of Dropped_packets for Router_3 and Router_4, as reported in Queue_Metrics_Table?
Buffer_Occupancy_ROUTER_4_Interface_1 Buffer_Occupancy_ROUTER_3_Interface_2
Step by Step Solution
There are 3 Steps involved in it

Get step-by-step solutions from verified subject matter experts