Answered step by step
Verified Expert Solution
Link Copied!

Question

1 Approved Answer

Conceptual Overview: Explore how inflation changes the security market line. The Security Market Line defines the required rate of return for a security to be

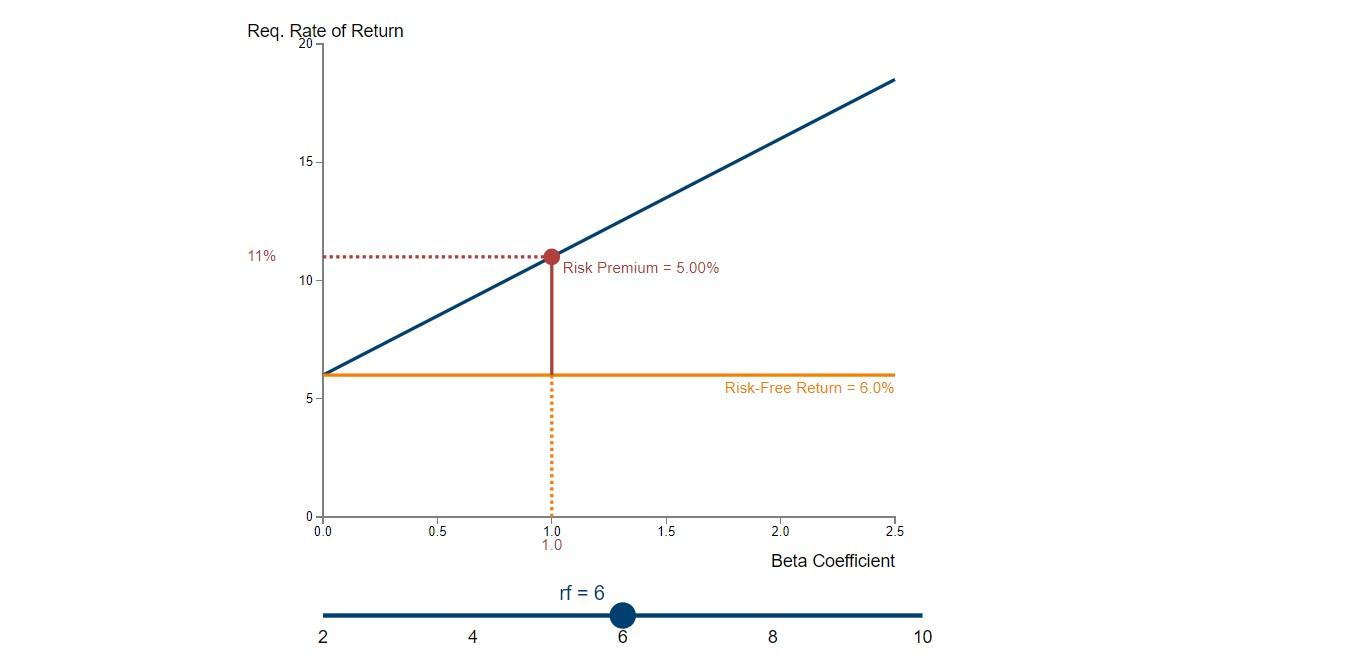
image text in transcribedimage text in transcribedimage text in transcribed

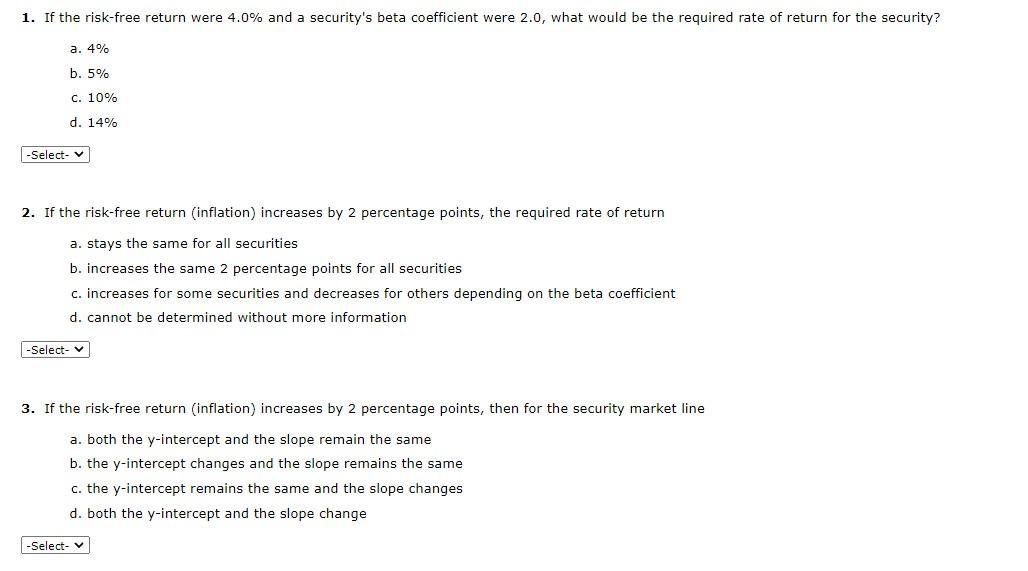
Conceptual Overview: Explore how inflation changes the security market line. The Security Market Line defines the required rate of return for a security to be worth buying or holding. The line, depicted in blue in the graph, is the sum of the risk-free return (rf in the slider) and a risk premium determined by the market-risk premium (RPM) multiplied by the security's beta coefficient for risk. Drag the slider below the graph to change the amount of the risk-free return. These changes reflect changes in inflation. Drag left or right on the graph to move the cursor to evaluate securities with different beta coefficients. In this graph, the market-risk premium is fixed at 5%. r=rRF + RPM * beta = 6% + 5%*1 = 6% + 5.00% = 11.00% Req. Rate of Return 15 11% Risk Premium = 5.00% 10 Risk-Free Return = 6.0% 5 0 0.0 0.5 1.0 1.0 1.5 2.0 25 Beta Coefficient rf = 6 2 4 8 10 1. If the risk-free return were 4.0% and a security's beta coefficient were 2.0, what would be the required rate of return for the security? a. 4% b. 5% C. 10% d. 14% -Select- 2. If the risk-free return (inflation) increases by 2 percentage points, the required rate of return a. stays the same for all securities b. increases the same 2 percentage points for all securities c. increases for some securities and decreases for others depending on the beta coefficient d. cannot be determined without more information -Select- 3. If the risk-free return (inflation) increases by 2 percentage points, then for the security market line a. both the y-intercept and the slope remain the same b. the y-intercept changes and the slope remains the same c. the y-intercept remains the same and the slope changes d. both the y-intercept and the slope change -Select
Step by Step Solution

There are 3 Steps involved in it

Step: 1

blur-text-image

Get Instant Access to Expert-Tailored Solutions

See step-by-step solutions with expert insights and AI powered tools for academic success

Step: 2

blur-text-image_2

Step: 3

blur-text-image_3

Ace Your Homework with AI

Get the answers you need in no time with our AI-driven, step-by-step assistance

Get Started

Recommended Textbook for

Finance And Economics Discussion Series Measurement Error And Time Aggregation A Closer Look At Estimates Of Output Labor Elasticities

Authors: United States Federal Reserve Board, Marcello Estevao

1st Edition

1288722990, 9781288722990

More Books

Students also viewed these Finance questions