

Question
Conceptual Overview: Explore how parallel coordinate plots can reveal differences between groups. In a parallel coordinates plot, the axes for different variables are aligned so
Conceptual Overview: Explore how parallel coordinate plots can reveal differences between groups.
In a parallel coordinates plot, the axes for different variables are aligned so that their maximum and minimum values are (approximately) at the top and bottom, respectively, of dimension. The graph below plots seasonal data for two baseball players playing two different positions: first base ('1B', the solid blue line) and second base ('2B', the dashed red line). Players are compared across the three dimensions of home runs hit, bases stolen, and batting average. Can you see the difference in pattern for the two types of players? Click on the graph to cycle through displays of both types of players, first base only, and second base only.
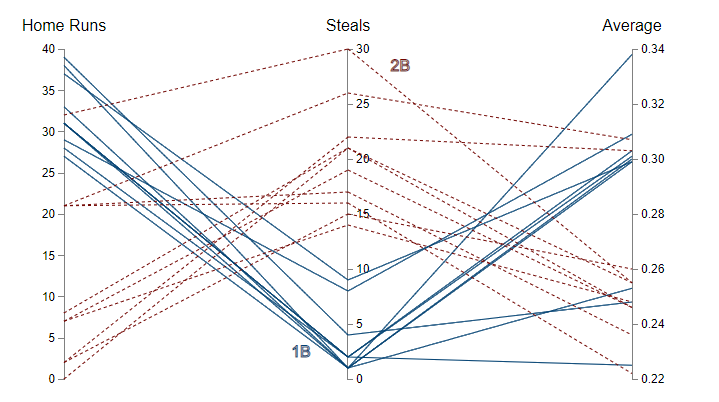
1. Looking at the data for first base players, which of the following statements is least accurate for the sample taken?
- They tend to hit a large number of home runs, at least 25.
- They do not steal bases often.
- Using this graph, if you know how many homes runs a player hit, then you can determine the batting average for that player.
- There are a few players who must have relatively fewer successful at-bats, as their batting averages are lower even though they have several home runs.
2. Looking at the data for second base players, which of the following statements is least accurate for the sample taken?
- Most tend to hit a small number of home runs.
- They tend to steal bases often.
- They tend to have low batting averages.
- The higher the number of a players home runs, the higher the batting average.
3. Looking at the data for both types of players at once, which of the following statements is least accurate for the sample taken?
- The first base players tend to hit more home runs than second base players.
- In this sample, every second base player has stolen more bases than every first base player.
- In this sample, every first base player has hit more home runs than every second base player.
- The first base players tend to have higher batting averages than second base players.
Step by Step Solution
There are 3 Steps involved in it
Step: 1

Get Instant Access to Expert-Tailored Solutions
See step-by-step solutions with expert insights and AI powered tools for academic success
Step: 2

Step: 3
Ace Your Homework with AI
Get the answers you need in no time with our AI-driven, step-by-step assistance
Get Started
Auditing A Modern Approach
Authors: Sanjay Basotia
1st Edition
938092903X, 978-9380929033