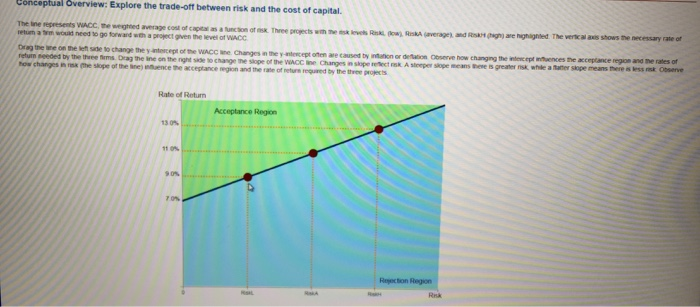
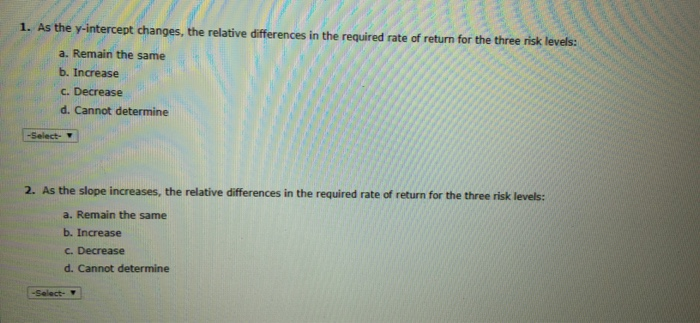
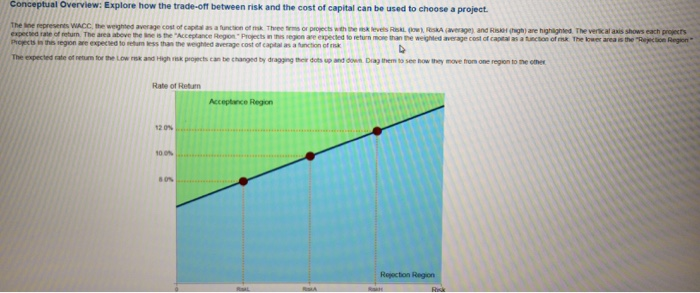
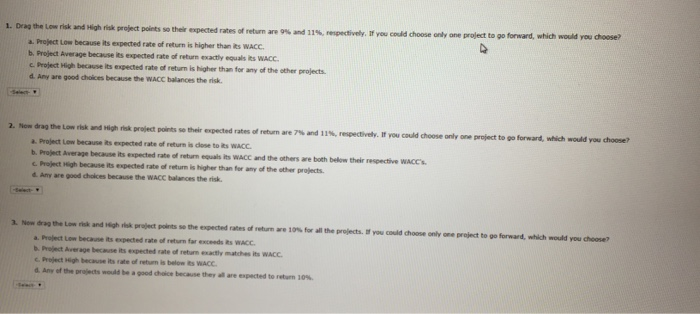
Conceptual Overview: Explore the trade-off between risk and the cost of capital. The ine represents WACC, the weghted average cost of captal as a funcson of x. Three progects with he ask lewels Rsk ow) RiskA (average) and Rsk(gh) are highighted The vertic al axis shows the necessary rate of returm a t woud need to go forwand wth a project given the level of WACC Drag the ne on the left sade to change the y intecept of the WACC ne Changes in the y-ntercept often are caused by intation or detation Observe how changing the intewcept nuences the acceptance region and the rates of refutn seeded by the theee fims. Drag the ine on the right side to change the siope of the WACC ine Changes in skope retect mk A steeper slope means heve is greater nsk whle a tater skope means there is less mk Oserve how changesn sx he slope of the ine) nuence the acceptance region and the rate of reture requed by the three projects Rate of Return Acceptance Region 13 0% 11 0% 90% 70% Reection Region Rek 1. As the y-intercept changes, the relative differences in the reguired rate of return for the three risk levels: a. Remain the same b. Increase C. Decrease d. Cannot determine -Select- 2. As the slope increases, the relative differences in the required rate of return for the three risk levels: a. Remain the same b. Increase c. Decrease d. Cannot determine -Select- Conceptual Overview: Explore how the trade-off between risk and the cost of capital can be used to choose a project The ine represents WACC, the weighted average cost of capital as a function of nsk Three tms or projects wth te mk levels RiskL ow), RskA (average) and RisH (hgh) are highighted The verkal axis shows each projects expected rate of retun. The area above the ine is the "Acceptance Regon Projects in hs region are expected to return mone than the weighted average cost of captal as a tuncton of rnk The lower area is the "Rejecon Region Proects in ths region are exxpeced to retum ess than the weighted average cost of capital as a function of rsk The expected rate of retum tor the Low rex and High risk projects can be changed by dragging their dots up and down Drag them to see how they move from one region to he other Rate of Return Acceptance Region 12 0% 10.0% s0% Rejection Region Risk 1. Drag the Low risk and High risk project points so their expected rates of return are 9% and 11 % , respectively, If you could choose only one project to go forward, which would you choose" a. Project Low because its expected rate of return is higher than its WACC b. Project Average because its expected rate of return exactly equals its WACC c. Project High because its expected rate of return is higher than for any of the other projects d. Any are good choices because the WACC balances the risk. Select 2. Now drag the Low risk and High risk project points se their expected rates of return are 7% and 11 % , respectively. If you could choose only one project to go forward, which would youu choose? a. Project Low because its expected rate of return is close to ts WACC b. Project Average because its expected rate of return equals its WACC and the others are both below their respective WACC's Project High because its expected rate of return is higher than for any of the other projects. d Any are good choices because the WACC balances the risk Now drag the Low risk and igh risk project points so the expected rates of return are 10% for all the projects. If you could choose only one project to go forward, which would 3 you choose? a. Project Low because its expected rate of return far exceeds ts WACC b. Project Average because its expected rate of return exactly matches its WACC c. Project High because its rate of retum is below ts WACC d Any of the pralects would be a good chaice because they all are expected to return 10 % Conceptual Overview: Explore the trade-off between risk and the cost of capital. The ine represents WACC, the weghted average cost of captal as a funcson of x. Three progects with he ask lewels Rsk ow) RiskA (average) and Rsk(gh) are highighted The vertic al axis shows the necessary rate of returm a t woud need to go forwand wth a project given the level of WACC Drag the ne on the left sade to change the y intecept of the WACC ne Changes in the y-ntercept often are caused by intation or detation Observe how changing the intewcept nuences the acceptance region and the rates of refutn seeded by the theee fims. Drag the ine on the right side to change the siope of the WACC ine Changes in skope retect mk A steeper slope means heve is greater nsk whle a tater skope means there is less mk Oserve how changesn sx he slope of the ine) nuence the acceptance region and the rate of reture requed by the three projects Rate of Return Acceptance Region 13 0% 11 0% 90% 70% Reection Region Rek 1. As the y-intercept changes, the relative differences in the reguired rate of return for the three risk levels: a. Remain the same b. Increase C. Decrease d. Cannot determine -Select- 2. As the slope increases, the relative differences in the required rate of return for the three risk levels: a. Remain the same b. Increase c. Decrease d. Cannot determine -Select- Conceptual Overview: Explore how the trade-off between risk and the cost of capital can be used to choose a project The ine represents WACC, the weighted average cost of capital as a function of nsk Three tms or projects wth te mk levels RiskL ow), RskA (average) and RisH (hgh) are highighted The verkal axis shows each projects expected rate of retun. The area above the ine is the "Acceptance Regon Projects in hs region are expected to return mone than the weighted average cost of captal as a tuncton of rnk The lower area is the "Rejecon Region Proects in ths region are exxpeced to retum ess than the weighted average cost of capital as a function of rsk The expected rate of retum tor the Low rex and High risk projects can be changed by dragging their dots up and down Drag them to see how they move from one region to he other Rate of Return Acceptance Region 12 0% 10.0% s0% Rejection Region Risk 1. Drag the Low risk and High risk project points so their expected rates of return are 9% and 11 % , respectively, If you could choose only one project to go forward, which would you choose" a. Project Low because its expected rate of return is higher than its WACC b. Project Average because its expected rate of return exactly equals its WACC c. Project High because its expected rate of return is higher than for any of the other projects d. Any are good choices because the WACC balances the risk. Select 2. Now drag the Low risk and High risk project points se their expected rates of return are 7% and 11 % , respectively. If you could choose only one project to go forward, which would youu choose? a. Project Low because its expected rate of return is close to ts WACC b. Project Average because its expected rate of return equals its WACC and the others are both below their respective WACC's Project High because its expected rate of return is higher than for any of the other projects. d Any are good choices because the WACC balances the risk Now drag the Low risk and igh risk project points so the expected rates of return are 10% for all the projects. If you could choose only one project to go forward, which would 3 you choose? a. Project Low because its expected rate of return far exceeds ts WACC b. Project Average because its expected rate of return exactly matches its WACC c. Project High because its rate of retum is below ts WACC d Any of the pralects would be a good chaice because they all are expected to return 10 %


