

Answered step by step
Verified Expert Solution
Question
1 Approved Answer
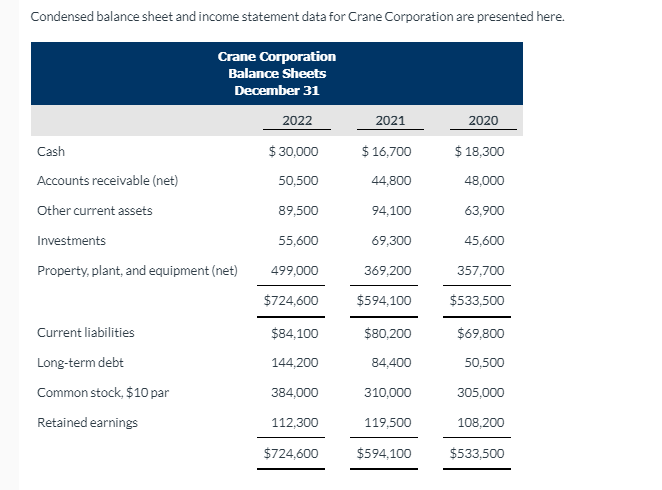
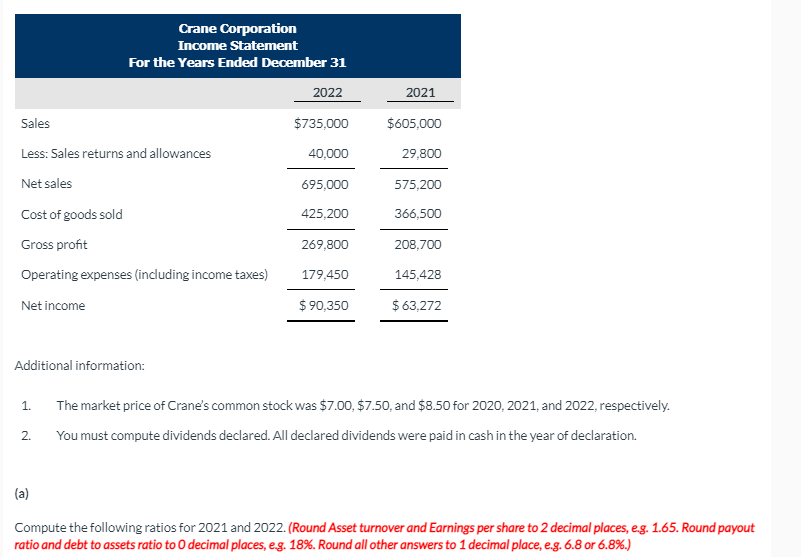
Condensed balance sheet and income statement data for Crane Corporation are presented here. Crane Corporation Balance Sheets December 31 2022 2021 2020 Cash $ 16,700
Step by Step Solution
There are 3 Steps involved in it
Step: 1

Get Instant Access to Expert-Tailored Solutions
See step-by-step solutions with expert insights and AI powered tools for academic success
Step: 2

Step: 3
Ace Your Homework with AI
Get the answers you need in no time with our AI-driven, step-by-step assistance
Get Started
Financial Accounting Tools for business decision making
Authors: Paul D. Kimmel, Jerry J. Weygandt, Donald E. Kieso
6th Edition
978-1119191674, 047053477X, 111919167X, 978-0470534779