

Question
Condensed balance sheet and income statement data for Jergan Corporation are presented here. Jergan Corporation Balance Sheets December 31 2020 2019 2018 Cash $ 29,000
Condensed balance sheet and income statement data for Jergan Corporation are presented here.
| Jergan Corporation Balance Sheets December 31 | |||||||||
|---|---|---|---|---|---|---|---|---|---|
| 2020 | 2019 | 2018 | |||||||
| Cash | $ 29,000 | $ 16,000 | $ 17,000 | ||||||
| Accounts receivable (net) | 49,000 | 44,000 | 47,000 | ||||||
| Other current assets | 89,000 | 94,000 | 63,000 | ||||||
| Investments | 54,000 | 69,000 | 44,000 | ||||||
| Plant and equipment (net) | 499,000 | 369,000 | 357,000 | ||||||
| $720,000 | $592,000 | $528,000 | |||||||
| Current liabilities | $84,000 | $79,000 | $69,000 | ||||||
| Long-term debt | 144,000 | 84,000 | 49,000 | ||||||
| Common stock, $10 par | 315,000 | 309,000 | 295,000 | ||||||
| Retained earnings | 177,000 | 120,000 | 115,000 | ||||||
| $720,000 | $592,000 | $528,000 | |||||||
| Jergan Corporation Income Statement For the Years Ended December 31 | ||||||
|---|---|---|---|---|---|---|
| 2020 | 2019 | |||||
| Sales revenue | $735,000 | $605,000 | ||||
| Less: Sales returns and allowances | 39,000 | 29,000 | ||||
| Net sales | 696,000 | 576,000 | ||||
| Cost of goods sold | 426,000 | 365,000 | ||||
| Gross profit | 270,000 | 211,000 | ||||
| Operating expenses (including income taxes) | 179,520 | 147,640 | ||||
| Net income | $ 90,480 | $ 63,360 | ||||
Additional information:
| 1. | The market price of Jergans common stock was $7.00, $7.50, and $8.50 for 2018, 2019, and 2020, respectively. | |
| 2. | You must compute dividends paid. All dividends were paid in cash. |
(a) Compute the following ratios for 2019 and 2020. (Round Asset turnover and Earnings per share to 2 decimal places, e.g. 1.65. Round payout ratio and debt to assets ratio to 0 decimal places, e.g. 18%. Round all other answers to 1 decimal place, e.g. 6.8 or 6.8%.) 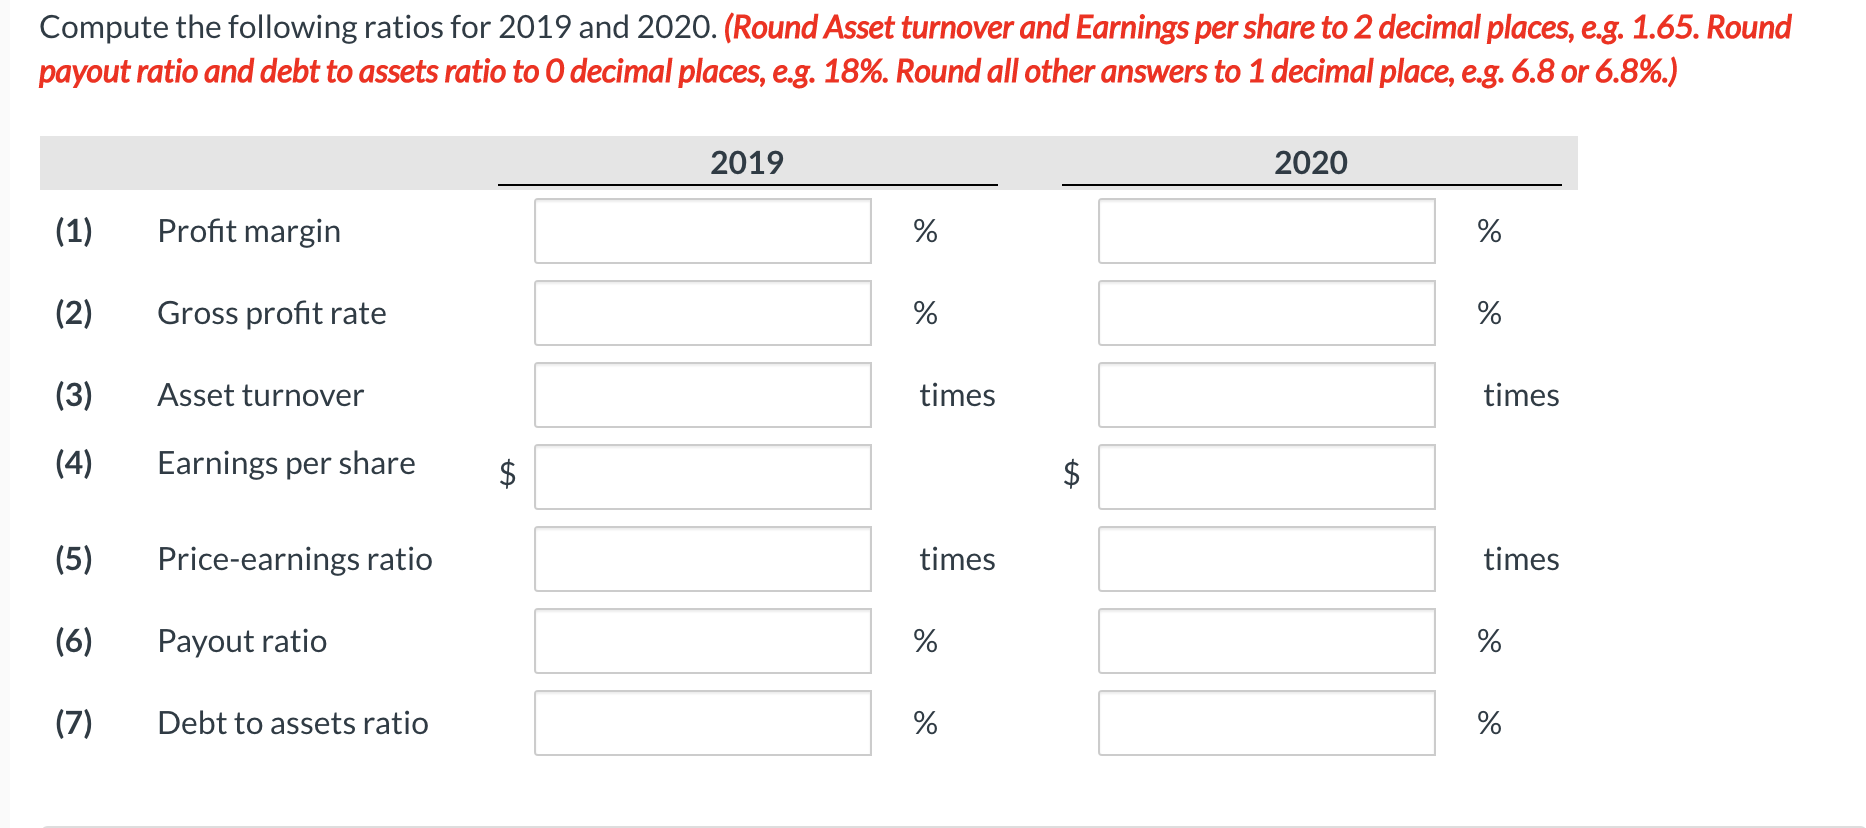
Step by Step Solution
There are 3 Steps involved in it
Step: 1

Get Instant Access to Expert-Tailored Solutions
See step-by-step solutions with expert insights and AI powered tools for academic success
Step: 2

Step: 3
Ace Your Homework with AI
Get the answers you need in no time with our AI-driven, step-by-step assistance
Get Started
Managerial accounting
Authors: ramji balakrishnan, k. s i varamakrishnan, Geoffrey b. sprin
1st edition
471467855, 978-0471467854