

Answered step by step
Verified Expert Solution
Question
1 Approved Answer
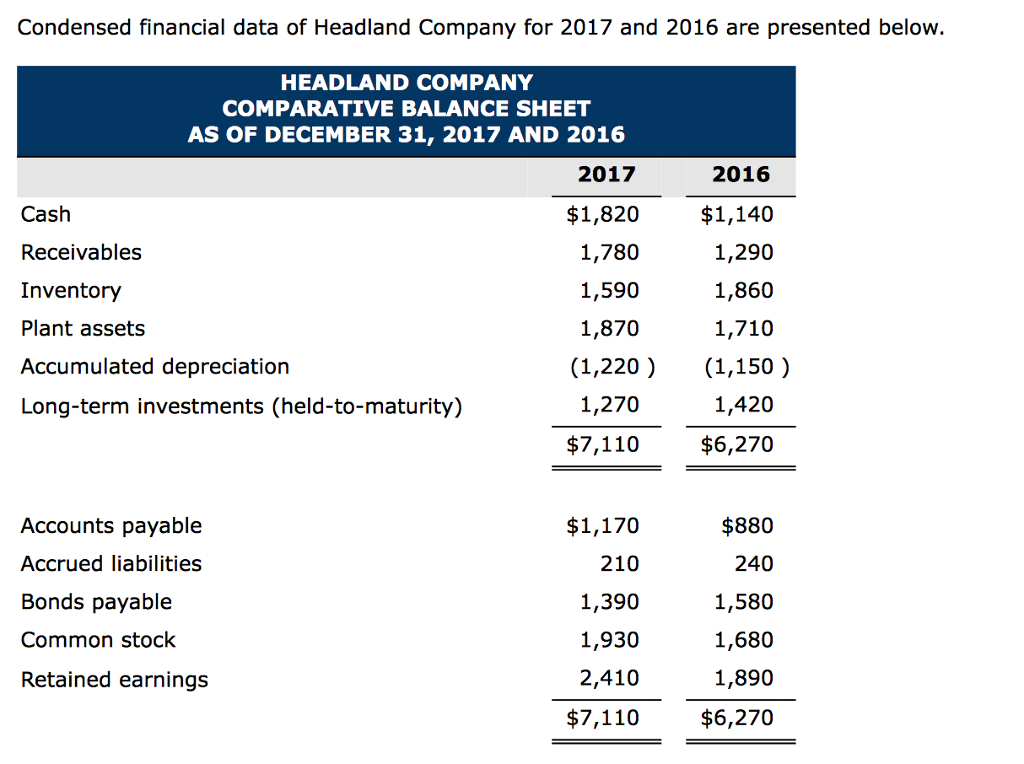
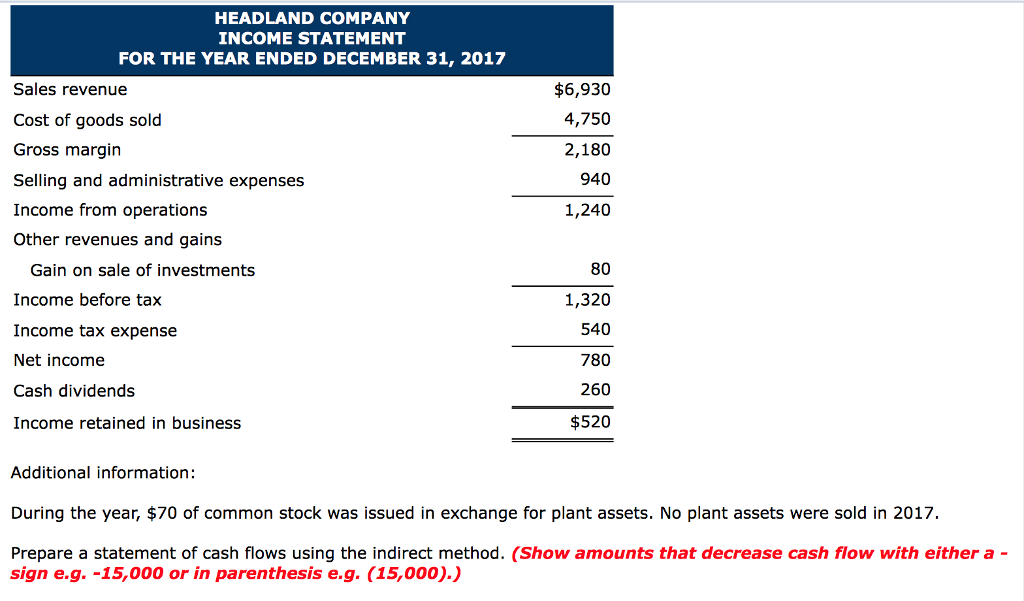
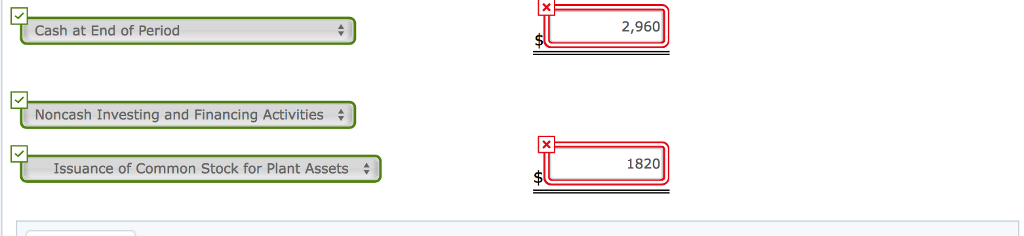
Condensed financial data of Headland Company for 2017 and 2016 are presented below HEADLAND COMPANY COMPARATIVE BALANCE SHEET AS OF DECEMBER 31, 2017 AND 2016
Step by Step Solution
There are 3 Steps involved in it
Step: 1

Get Instant Access to Expert-Tailored Solutions
See step-by-step solutions with expert insights and AI powered tools for academic success
Step: 2

Step: 3
Ace Your Homework with AI
Get the answers you need in no time with our AI-driven, step-by-step assistance
Get Started
Knowledge Assets And Knowledge Audits Working Methods For Knowledge Management
Authors: Pawan Handa, Jean Pagani, Denise Bedford
1st Edition
1789737745, 978-1789737745