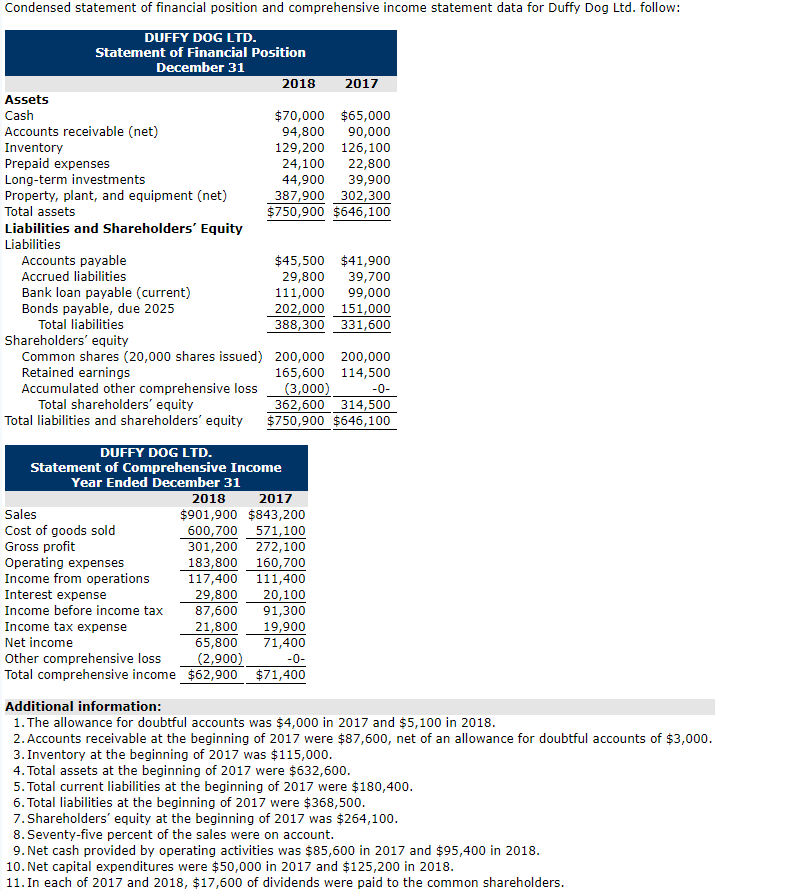
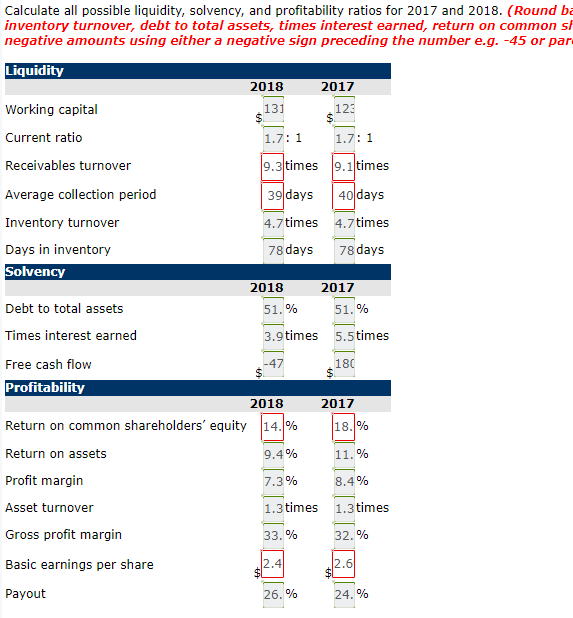
Condensed statement of financial position and comprehensive income statement data for Duffy Dog Ltd. follow: DUFFY DOG LTD Statement of Financial Position December 31 2018 2017 Assets Cash Accounts receivable (net) Inventory Prepaid expenses Long-term investments Property, plant, and equipment (net) Total assets Liabilities and Shareholders' Equity Liabilities $70,000 $65,000 94,800 90,000 129,200 126,100 24,100 22,800 44,900 39,900 387,900 302,300 $750,900 $646,100 Accounts payable $45,500 $41,900 Accrued liabilities 29,800 39,700 Bank loan payable (current) 111,000 99,000 Bonds payable, due 2025 202,000 151,000 Total liabilities 388,300 331,600 Shareholders' equity Common shares (20,000 shares issued) 200,000 200,000 Retained earnings Accumulated other comprehensive loss (3,000)0 165,600 114,500 Total shareholders' equity 362,600 314,500 $750,900 $646,100 Total liabilities and shareholders' equity DUFFY DOG LTD Statement of Comprehensive Income Year Ended December 31 2018 2017 $901,900 $843,200 600,700 571,100 301,200 272,100 183,800 160,700 117,400 111,400 29,800 20,100 Cost of goods sold Gross profit Operating expenses Income from operations Interest expense Income before income tax 87,600 91,300 Income tax expense Net income Other comprehensive loss (2,900)0 Total comprehensive income $62,900 $71,400 21,800 19,900 65,800 71,400 Additional information: 1. The allowance for doubtful accounts was $4,000 in 2017 and $5,100 in 2018 2. Accounts receivable at the beginning of 2017 were $87,600, net of an allowance for doubtful accounts of $3,000 3. Inventory at the beginning of 2017 was $115,000 4. Total assets at the beginning of 2017 were $632,600 5. Total current liabilities at the beginning of 2017 were $180,400 6. Total liabilities at the beginning of 2017 were $368,500 7. Shareholders' equity at the beginning of 2017 was $264,100 8.Seventy-five percent of the sales were on account. 9. Net cash provided by operating activities was $85,600 in 2017 and $95,400 in 2018 10. Net capital expenditures were $50,000 in 2017 and $125,200 in 2018 11. In each of 2017 and 2018, $17,600 of dividends were paid to the common shareholders Calculate all possible liquidity, solvency, and profitability ratios for 2017 and 2018. (Round ba inventory turnover, debt to total assets, times interest earned, return on common sh negative amounts using either a negative sign preceding the number e.g. -45 or par 0 Liquidity Working capital Current ratio Receivables turnover Average collection period Inventory turnover 2018 2017 13 1.7: 1 9.3times 9.1 times 39days 40days 4.7times 4.7times 78days 78 days Days in inventory Solvency 2018 2017 Debt to total assets Times interest earned Free cash flow Profitability Return on common shareholders' equity 114.1% Return on assets Profit margin Asset turnover Gross profit margin Basic earnings per share Payout 51. % 1.96 9times 5.5times 180 2018 2017 18.1% 9.4% 3% 1.3times 33. % 8.4% 1.3 times 32.% 26. %