

Question
Conduct a financial analysis for Netflix for 2017, 2016, and 2015 using any six of the following financial ratios: current ratio, return on equity, return
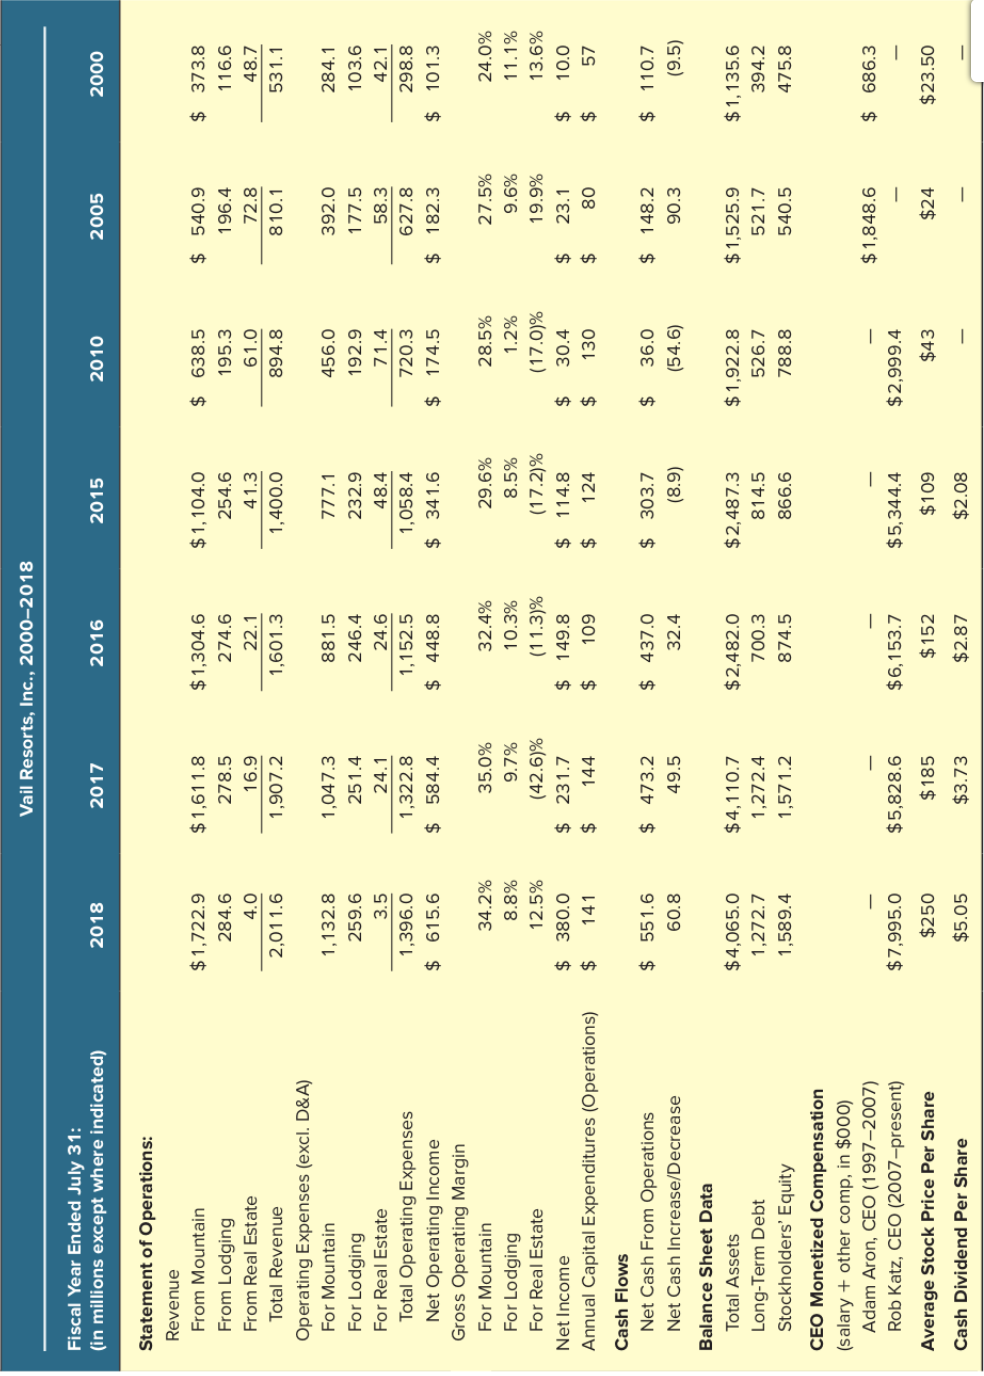 Conduct a financial analysis for Netflix for 2017, 2016, and 2015 using any six of the following financial ratios: current ratio, return on equity, return on assets, operating profit margin, coverage ratio, net profit margin, debt to assets, and debt to equity. Show your work. Tabulate your results.
Step by Step Solution
There are 3 Steps involved in it
Step: 1

Get Instant Access to Expert-Tailored Solutions
See step-by-step solutions with expert insights and AI powered tools for academic success
Step: 2

Step: 3
Ace Your Homework with AI
Get the answers you need in no time with our AI-driven, step-by-step assistance
Get Started
Managerial Accounting And Analysis In Multinational Enterprises
Authors: H P Holzer
1st Edition
3110100819, 978-3110100815