Answered step by step
Verified Expert Solution
Question
1 Approved Answer
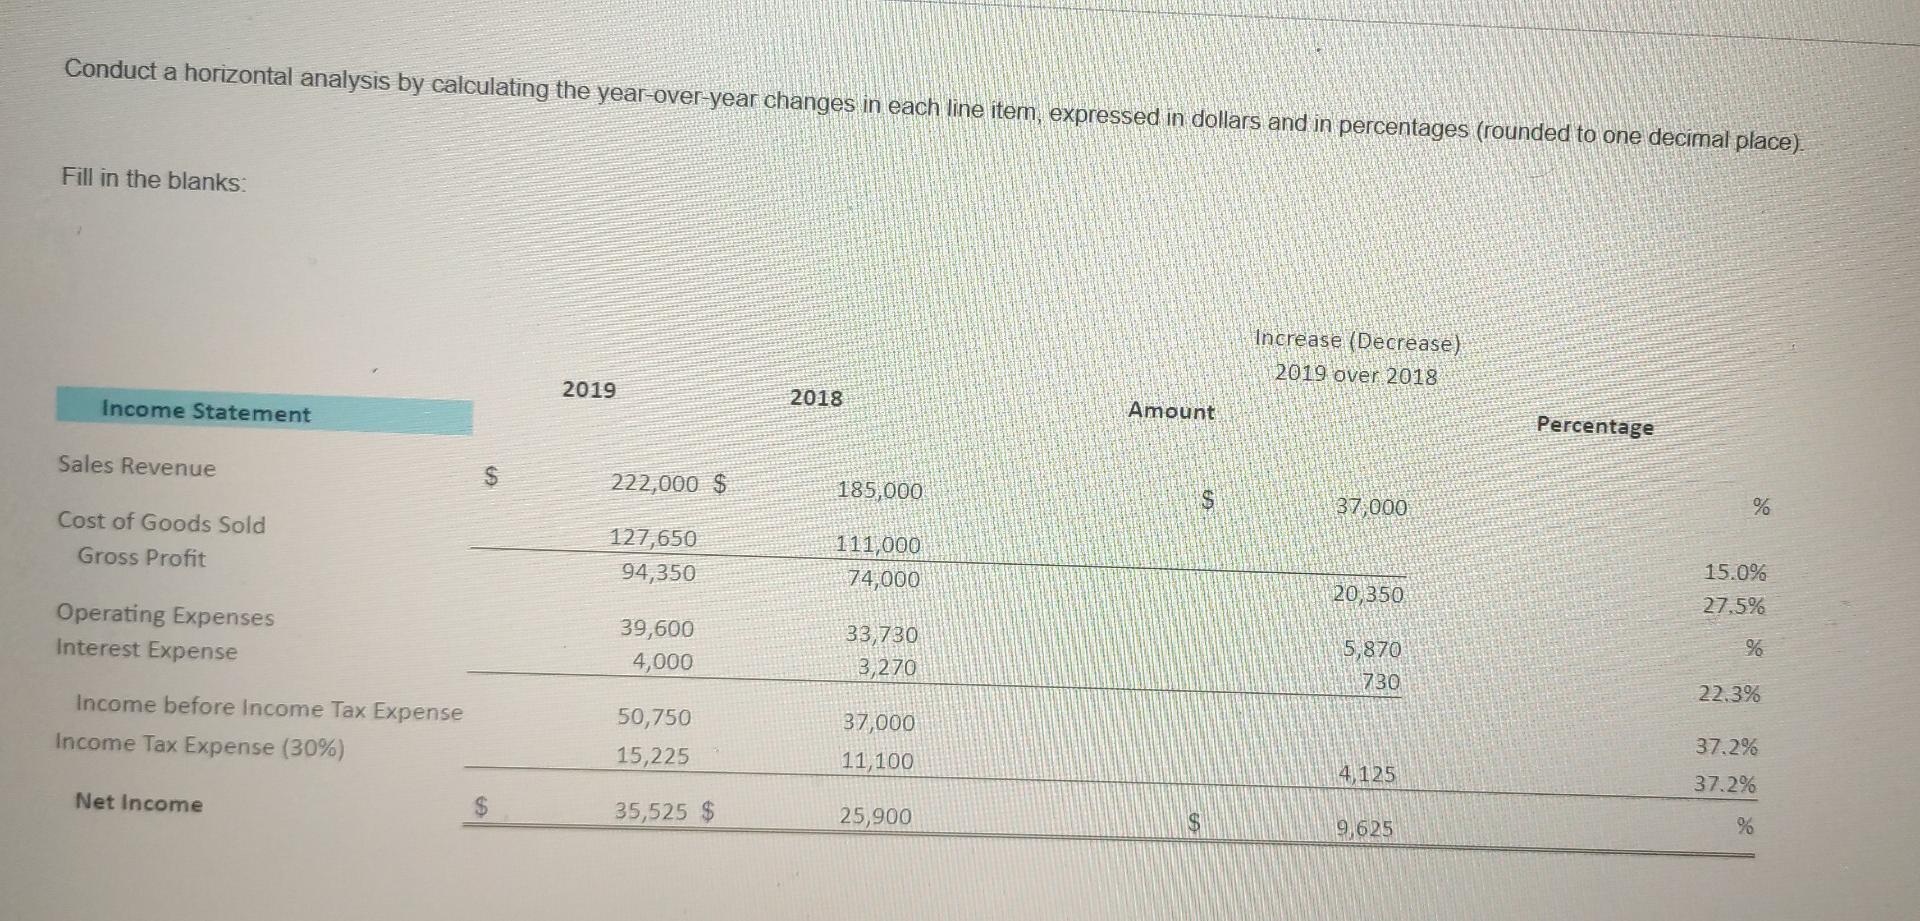
Conduct a horizontal analysis by calculating the year-over-year changes in each line item, expressed in dollars and in percentages (rounded to one decimal place). Fill

Conduct a horizontal analysis by calculating the year-over-year changes in each line item, expressed in dollars and in percentages (rounded to one decimal place). Fill in the blanks: Increase (Decrease) 2019 over 2018 2019 2018 Income Statement Amount Percentage Sales Revenue $ 222,000 $ 185,000 $ 37,000 % Cost of Goods Sold Gross Profit 127,650 94,350 111,000 74,000 20,350 15.0% 27.5% Operating Expenses Interest Expense 39,600 4,000 33,730 3,270 % 5,870 730 22.3% Income before Income Tax Expense Income Tax Expense (30%) 37,000 50,750 15,225 37.2% 11,100 4,125 37.2% Net Income 35,525 $ 25,900 $ 9,625 %
Step by Step Solution
There are 3 Steps involved in it
Step: 1

Get Instant Access to Expert-Tailored Solutions
See step-by-step solutions with expert insights and AI powered tools for academic success
Step: 2

Step: 3

Ace Your Homework with AI
Get the answers you need in no time with our AI-driven, step-by-step assistance
Get Started


