Question
Conduct a performance analysis by using the major performance ratios. ROE = (Net income/Pretax Net operating income) x (Pretax operating income/ Total Revenue) x (Total
Conduct a performance analysis by using the major performance ratios.
ROE = (Net income/Pretax Net operating income) x (Pretax operating income/ Total
Revenue) x (Total Revenue / Total Assets) x (Total Assets / Total Equity)
ROA= (Net Income / Total Operating Revenue) x (Total Operating Revenue / Total
Assets)
Earning Spread = (Total interest Income / Total Earning Assets) – (Total Interest
Expenses / Total Interest Bearing Liability)
Operating Efficiency Ratio = Total Operating Expenses / Total Operating Revenues
Credit Risk = Provision for Loan Losses / Total Loans
Liquidity Risk = Cash and Due From Banks / Total Assets
Capital Risk = Equity Capital / Total Assets 


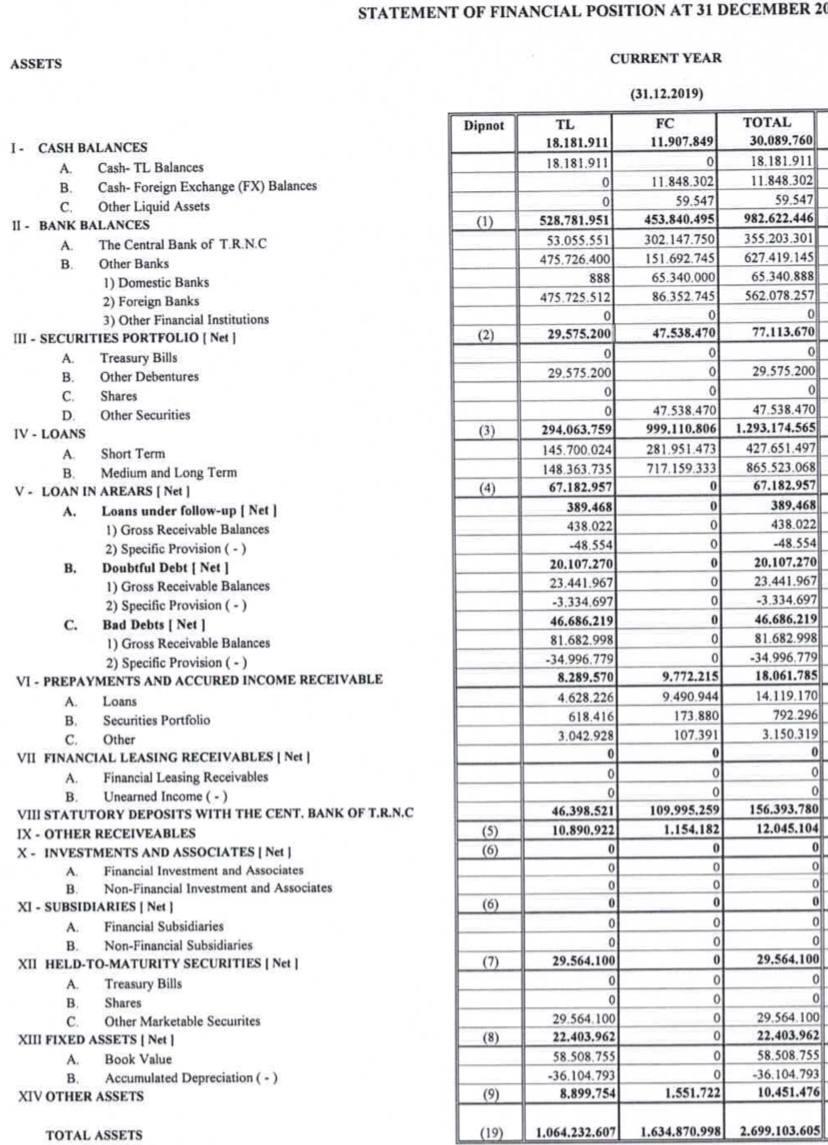
ASSETS I CASH BALANCES A. B. C. II BANK BALANCES A. B. A. B. III - SECURITIES PORTFOLIO [Net] A. Treasury Bills B. Other Debentures C. Shares D. Other Securities IV - LOANS B. Cash- TL Balances Cash-Foreign Exchange (FX) Balances: Other Liquid Assets V. LOAN IN AREARS [ Net] A. C. The Central Bank of T.R.N.C Other Banks 1) Domestic Banks 2) Foreign Banks 3) Other Financial Institutions Short Term Medium and Long Term 1) Gross Receivable Balances 2) Specific Provision (-) Bad Debts | Net] 1) Gross Receivable Balances 2) Specific Provision (-) VI- PREPAYMENTS AND ACCURED INCOME RECEIVABLE A. B. Loans under follow-up | Net] 1) Gross Receivable Balances 2) Specific Provision (-) Doubtful Debt [ Net] A. Loans B. C. VII FINANCIAL LEASING RECEIVABLES | Net | A. B. Securities Portfolio Other A. Financial Leasing Receivables B. Unearned Income (-) VIII STATUTORY DEPOSITS WITH THE CENT. BANK OF T.R.N.C. IX OTHER RECEIVEABLES X INVESTMENTS AND ASSOCIATES | Net] Financial Investment and Associates Non-Financial Investment and Associates XI- SUBSIDIARIES | Net] Financial Subsidiaries Non-Financial Subsidiaries XII HELD-TO-MATURITY SECURITIES | Net] A. Treasury Bills B. Shares C. Other Marketable Secuirites XIII FIXED ASSETS | Net | A. Book Value Accumulated Depreciation (-) STATEMENT OF FINANCIAL POSITION AT 31 DECEMBER 20 B. XIV OTHER ASSETS TOTAL ASSETS Dipnot (1) (2) (3) (4) (5) (6) (6) (7) (8) (9) TL 18.181.911 18.181.911 CURRENT YEAR 0 0 528.781.951 53.055.551 475.726.400 888 475.725.512 0 29.575.200 0 29.575.200 0 0 294.063.759 145.700.024 148.363.735 67.182.957 389.468 438.022 -48.554 20.107.270 23.441.967 -3.334.697 46.686.219 81.682.998 -34.996.779 8.289.570 4.628.226 618.416 3.042.928 0 0 0 46.398.521 10.890.922 0 0 0 0 0 0 29.564.100 0 0 29.564.100 22.403.962 58.508.755 -36.104.793 8.899,754 (31.12.2019) FC 11.907.849 0 11.848.302 59.547 453.840.495 302.147.750 151.692.745 65.340.000 86.352.745 0 47.538.470 0 0 0 0 0 0 0 0 0 0 0 0 0 9.772.215 9.490.944 173.880 107.391 0 0 0 47.538.470 47.538.470 999.110.806 1.293.174.565 281.951.473 717.159.333 109.995.259 1.154.182 0 0 0 0 0 0 0 0 0 0 0 0 0 TOTAL 1.551.722 30,089,760 18.181.911 11.848.302 59.547 982.622.446 355.203.301 627.419.145 65.340.888 562.078.257 0 77.113.670 0 29.575.200 0 427.651.497 865.523.068 67.182.957 389,468 438.022 -48.554 20,107,270 23.441.967 -3.334.697 46.686.219 81.682.998 -34.996.779 18.061.785 14.119.170 792.296 3.150.319 0 0 0 156.393.780 12.045.104 0 0 0 0 0 0 29.564,100 0 0 29.564.100 22.403.962 58.508.755 -36.104.793 10.451.476 (19) 1.064.232.607 1.634.870.998 2.699.103.605
Step by Step Solution
3.37 Rating (141 Votes )
There are 3 Steps involved in it
Step: 1
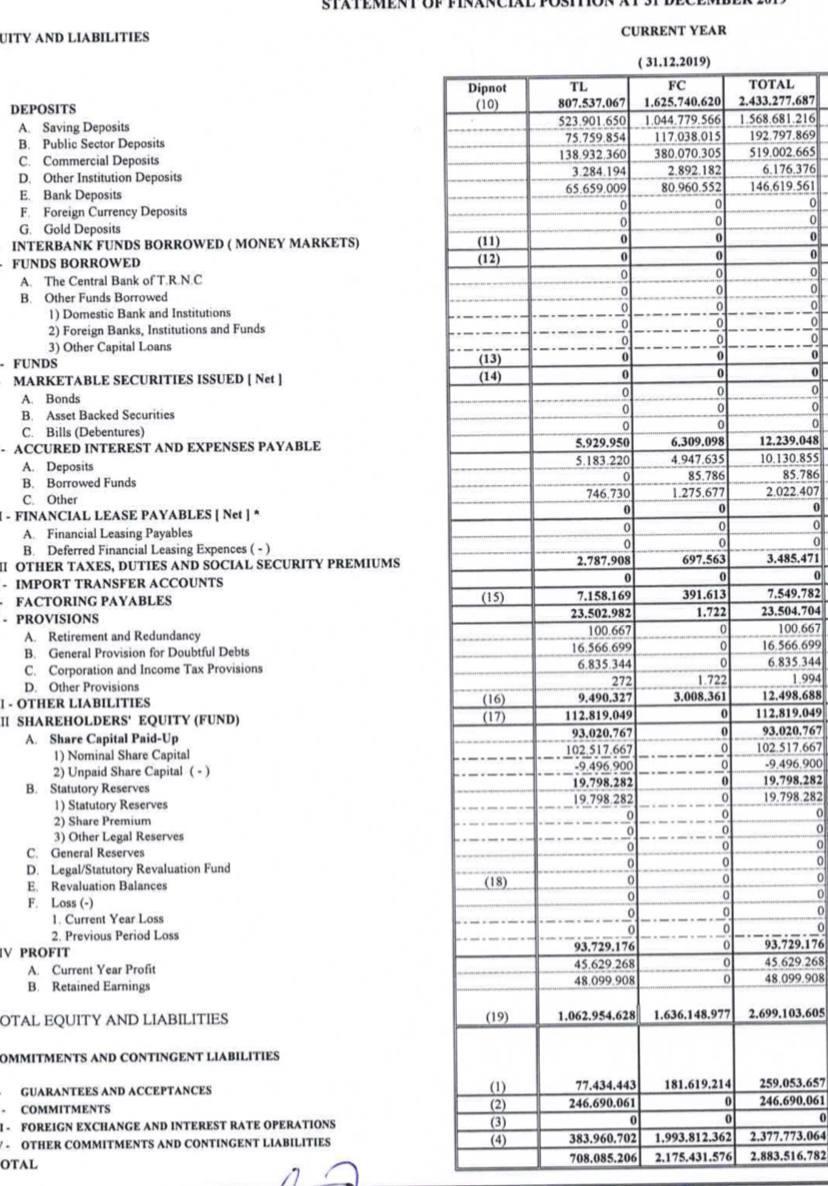
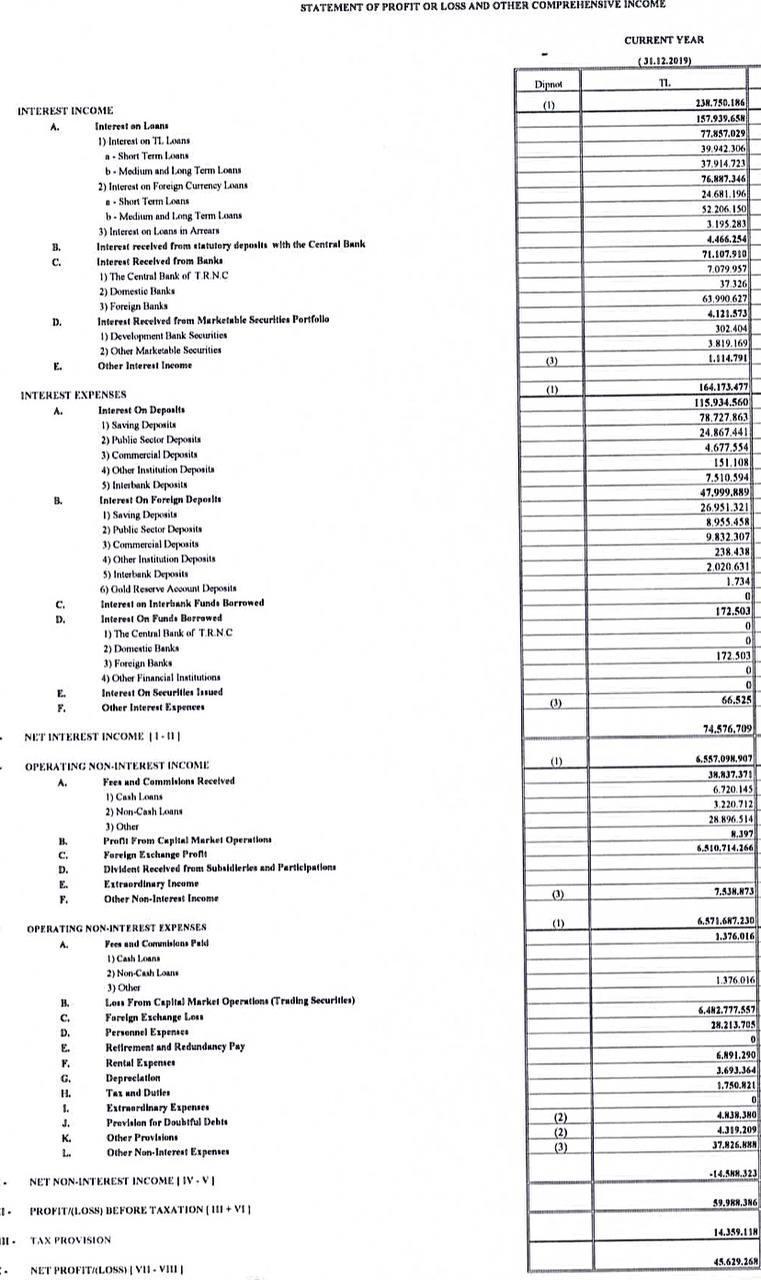
Answer R OE Net incomePretax Net operating income x Pretax operating income Total Revenue x Total Revenue Total Assets x Total Assets Total Equity Where Net Income 45629268 Pre Tax net operating incom...
Get Instant Access to Expert-Tailored Solutions
See step-by-step solutions with expert insights and AI powered tools for academic success
Step: 2

Step: 3

Ace Your Homework with AI
Get the answers you need in no time with our AI-driven, step-by-step assistance
Get Started


