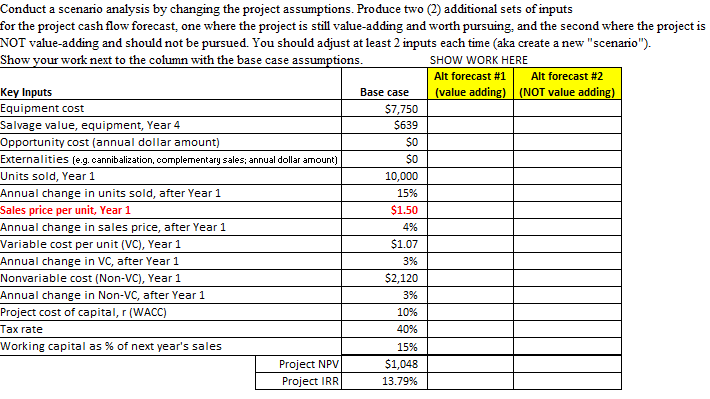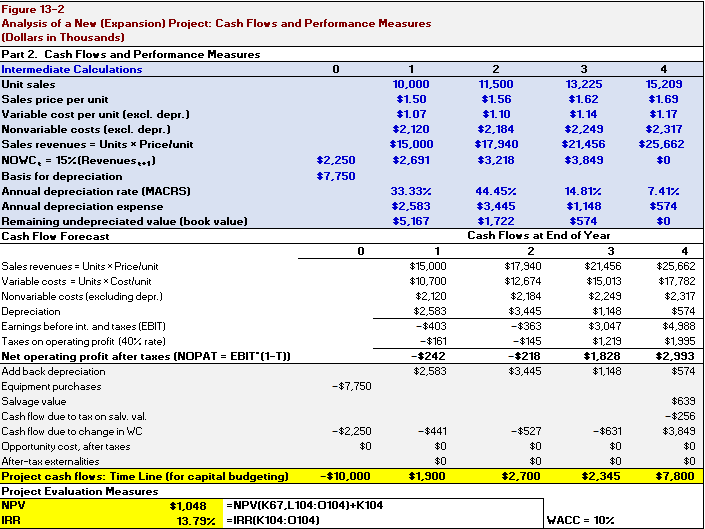

Conduct a scenario analysis by changing the project assumptions. Produce two (2) additional sets of inputs for the project cash flow forecast, one where the project is still value-adding and worth pursuing, and the second where the project is NOT value-adding and should not be pursued. You should adjust at least 2 inputs each time (aka create a new "scenario"). Show your work next to the column with the base case assumptions. SHOW WORK HERE Alt forecast #1 | Alt forecast #2 Key Inputs Base case (value adding) (NOT value adding) Equipment cost $7,750 Salvage value, equipment, Year 4 $639 Opportunity cost (annual dollar amount) Externalities (e.g. cannibalization, complementary sales; annual dollar amount) $0 Units sold, Year 1 10,000 Annual change in units sold, after Year 1 15% Sales price per unit, Year 1 $1.50 Annual change in sales price, after Year 1 Variable cost per unit (VC), Year 1 $1.07 Annual change in VC, after Year 1 3% Nonvariable cost (Non-VC), Year 1 $2,120 Annual change in Non-VC, after Year 1 Project cost of capital,r(WACC) 10% Tax rate 40% Working capital as % of next year's sales 15% Project NPV $1,048 Project IRR 13.79% 4% 3% Figure 13-2 Analysis of a New (Expansion) Project: Cash Flows and Performance Measures (Dollars in Thousands) Part 2. Cash Flors and Performance Measures Intermediate Calculations 0 1 Unit sales 10,000 Sales price per unit $1.50 Variable cost per unit (excl. depr.) $1.07 Nonvariable costs (excl. depr.) $2,120 Sales revenues = Units * Pricelunit $15,000 NOWC, - 157(Revenues +1] $2,250 $2,691 Basis for depreciation $7,750 Annual depreciation rate (MACRS) 33.33% Annual depreciation expense $2,583 Remaining undepreciated value (book value) $5,167 Cash Flow Forecast 2 11,500 $1.56 $1.10 $2,184 $17,940 $3,218 3 13,225 $1.62 $1.14 $2,249 $21,456 $3,849 4 15,209 $1.69 $1.17 $2,317 $25,662 $0 7.417 $574 44.45% 14.817 $3,445 $1,148 $1,722 $574 Cash Flors at End of Year $15,000 $10,700 $2,120 $2,583 -$403 - $161 -$242 $2,583 $17,940 $12,674 $2,184 $3,445 -$363 -$145 - $218 $3,445 $21,456 $15,013 $2,249 $1,148 $3,047 $1,219 $1,828 $1,148 $25,662 $17,782 $2,317 $574 $4,988 $1,995 $2,993 $574 Sales revenues = Units Pricelunit Variable costs = Units Cost/unit Nonvariable costs (excluding depr.) Depreciation Earnings before int. and taxes (EBIT) Taxes on operating profit (40% rate) Net operating profit after taxes (NOPATEBIT (1-1 Add back depreciation Equipment purchases - $7,750 Salvage value Cash flow due to tax on salv. val. Cash flow due to change in WC -$2,250 Opportunity cost, after taxes After-tax externalities Project cash flors: Time Line (for capital budgeting) -$10,000 Project Evaluation Measures NPV $1,048 -NPV(K67,L 104:0104)+K104 IRR 13.79% = IRR(K104:0104) $639 - $256 $3,849 -$441 -$527 $631 $0 $0 $0 $0 $0 $1,900 $2,700 $2,345 $7,800 WACC = 10% Conduct a scenario analysis by changing the project assumptions. Produce two (2) additional sets of inputs for the project cash flow forecast, one where the project is still value-adding and worth pursuing, and the second where the project is NOT value-adding and should not be pursued. You should adjust at least 2 inputs each time (aka create a new "scenario"). Show your work next to the column with the base case assumptions. SHOW WORK HERE Alt forecast #1 | Alt forecast #2 Key Inputs Base case (value adding) (NOT value adding) Equipment cost $7,750 Salvage value, equipment, Year 4 $639 Opportunity cost (annual dollar amount) Externalities (e.g. cannibalization, complementary sales; annual dollar amount) $0 Units sold, Year 1 10,000 Annual change in units sold, after Year 1 15% Sales price per unit, Year 1 $1.50 Annual change in sales price, after Year 1 Variable cost per unit (VC), Year 1 $1.07 Annual change in VC, after Year 1 3% Nonvariable cost (Non-VC), Year 1 $2,120 Annual change in Non-VC, after Year 1 Project cost of capital,r(WACC) 10% Tax rate 40% Working capital as % of next year's sales 15% Project NPV $1,048 Project IRR 13.79% 4% 3% Figure 13-2 Analysis of a New (Expansion) Project: Cash Flows and Performance Measures (Dollars in Thousands) Part 2. Cash Flors and Performance Measures Intermediate Calculations 0 1 Unit sales 10,000 Sales price per unit $1.50 Variable cost per unit (excl. depr.) $1.07 Nonvariable costs (excl. depr.) $2,120 Sales revenues = Units * Pricelunit $15,000 NOWC, - 157(Revenues +1] $2,250 $2,691 Basis for depreciation $7,750 Annual depreciation rate (MACRS) 33.33% Annual depreciation expense $2,583 Remaining undepreciated value (book value) $5,167 Cash Flow Forecast 2 11,500 $1.56 $1.10 $2,184 $17,940 $3,218 3 13,225 $1.62 $1.14 $2,249 $21,456 $3,849 4 15,209 $1.69 $1.17 $2,317 $25,662 $0 7.417 $574 44.45% 14.817 $3,445 $1,148 $1,722 $574 Cash Flors at End of Year $15,000 $10,700 $2,120 $2,583 -$403 - $161 -$242 $2,583 $17,940 $12,674 $2,184 $3,445 -$363 -$145 - $218 $3,445 $21,456 $15,013 $2,249 $1,148 $3,047 $1,219 $1,828 $1,148 $25,662 $17,782 $2,317 $574 $4,988 $1,995 $2,993 $574 Sales revenues = Units Pricelunit Variable costs = Units Cost/unit Nonvariable costs (excluding depr.) Depreciation Earnings before int. and taxes (EBIT) Taxes on operating profit (40% rate) Net operating profit after taxes (NOPATEBIT (1-1 Add back depreciation Equipment purchases - $7,750 Salvage value Cash flow due to tax on salv. val. Cash flow due to change in WC -$2,250 Opportunity cost, after taxes After-tax externalities Project cash flors: Time Line (for capital budgeting) -$10,000 Project Evaluation Measures NPV $1,048 -NPV(K67,L 104:0104)+K104 IRR 13.79% = IRR(K104:0104) $639 - $256 $3,849 -$441 -$527 $631 $0 $0 $0 $0 $0 $1,900 $2,700 $2,345 $7,800 WACC = 10%


