Answered step by step
Verified Expert Solution
Question
1 Approved Answer
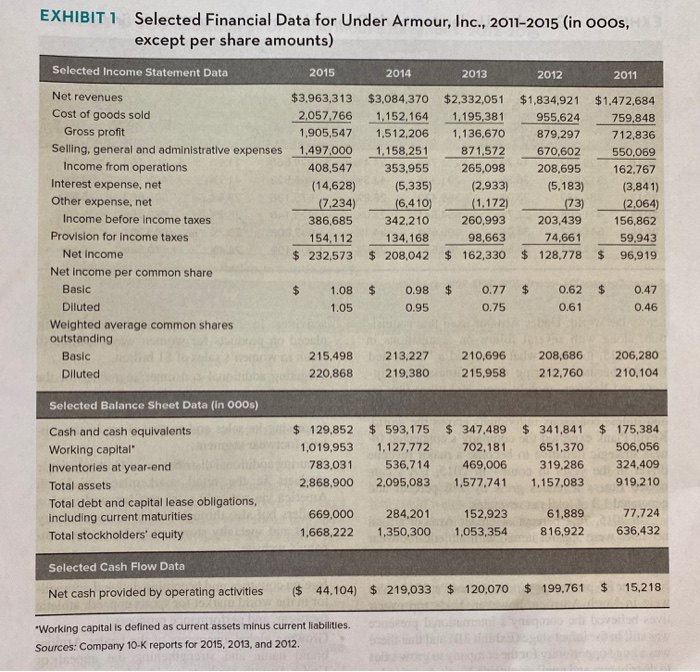
conduct a strategic financial analysis for under armour. How is Under Armour perfoming from a strategic financial standpoint and why? calculation of the current ratio
conduct a strategic financial analysis for under armour. How is Under Armour perfoming from a strategic financial standpoint and why? 


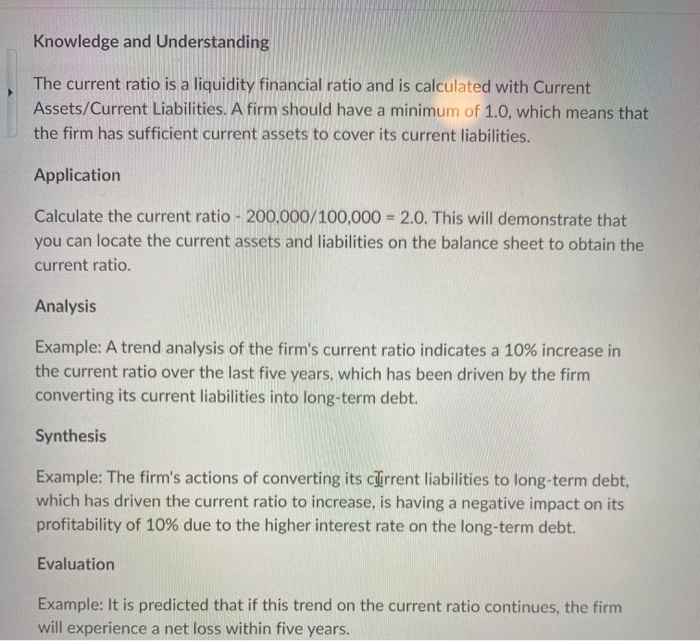
calculation of the current ratio is needed
example: 
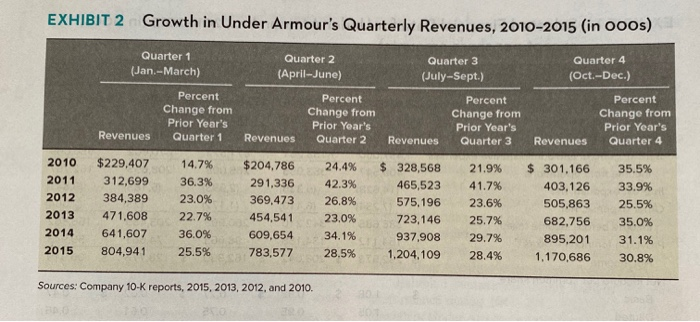
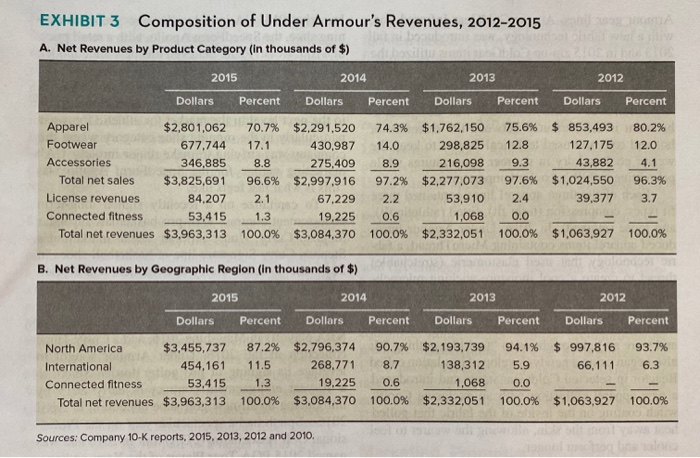
EXHIBIT 1 Selected Financial Data for Under Armour, Inc., 2011-2015 (in ooos, except per share amounts) Selected Income Statement Data 2015 2014 2013 2012 2011 Net revenues Cost of goods sold Gross profit Selling, general and administrative expenses Income from operations Interest expense, net Other expense, net Income before income taxes Provision for income taxes Net Income Net Income per common share Basic Diluted Weighted average common shares outstanding Basic Diluted $3,963,313 2.057.766 1.905,547 1,497.000 408,547 (14,628) (7.234) 386,685 154,112 $ 232,573 $3,084,370 1,152,164 1.512,206 1,158,251 353,955 (5,335) (6,410) 342.210 134,168 $ 208,042 $2,332,051 1.195,381 1,136,670 871,572 265,098 (2.933) (1,172) 260,993 98,663 $ 162,330 $1,834,921 955,624 879,297 670,602 208,695 (5.183) (73) 203,439 74,661 $ 128,778 $1,472,684 759,848 712,836 550,069 162,767 (3,841) (2,064) 156,862 59,943 $ 96,919 $ $ $ $ $ 1.08 1.05 0.98 0.95 0.77 0.75 0.62 0.61 0.47 0.46 215,498 220,868 213,227 219.380 210,696 208,686 215,958 212,760 206,280 210,104 Selected Balance Sheet Data (in 000s) Cash and cash equivalents Working capital Inventories at year-end Total assets Total debt and capital lease obligations, including current maturities Total stockholders' equity $ 129,852 1,019.953 783,031 2,868,900 $ 593,175 1,127,772 536,714 2,095,083 $ 347,489 702,181 469,006 1,577,741 $ 341,841 651,370 319.286 1,157,083 $ 175,384 506,056 324,409 919,210 669,000 1,668,222 284,201 1,350,300 152,923 1,053,354 61,889 816,922 77.724 636,432 Selected Cash Flow Data Net cash provided by operating activities ($ 44,104) $ 219,033 $ 120,070 $ 199,761 $ 15,218 "Working capital is defined as current assets minus current liabilities. Sources: Company 10-K reports for 2015, 2013, and 2012 EXHIBIT 2 Growth in Under Armour's Quarterly Revenues, 2010-2015 (in ooos) Quarter 1 (Jan-March) Quarter 2 (April-June) Quarter 3 (July-Sept.) Quarter 4 (Oct.-Dec.) Percent Change from Prior Year's Quarter 1 Percent Change from Prior Year's Quarter 2 Percent Change from Prior Year's Quarter 3 Percent Change from Prior Year's Quarter 4 Revenues Revenues Revenues Revenues 2010 2011 2012 2013 2014 2015 $229,407 312,699 384,389 471,608 641,607 804,941 14.7% 36.3% 23.0% 22.7% 36.0% 25.5% $204,786 291,336 369,473 454,541 609,654 783,577 24.4% 42.3% 26.8% 23.0% 34.1% 28.5% $ 328,568 465,523 575,196 723,146 937,908 1,204,109 21.9% 41.7% 23.6% 25.7% 29.7% 28.4% $ 301.166 403,126 505,863 682,756 895,201 1.170.686 35.5% 33.9% 25.5% 35.0% 31.1% 30.8% Sources: Company 10-K reports, 2015, 2013, 2012, and 2010. EXHIBIT 3 Composition of Under Armour's Revenues, 2012-2015 A. Net Revenues by Product Category (in thousands of $) 2015 2014 2013 2012 Dollars Percent Dollars Percent Dollars Percent Dollars Percent Apparel $2,801,062 Footwear 677,744 Accessories 346.885 Total net sales $3,825,691 License revenues 84.207 Connected fitness 53,415 Total net revenues $3,963,313 70.7% $2,291,520 74.3% $1,762,150 75.6% $ 853,493 17.1 430,987 14.0 298,825 12.8 127.175 8.8 275,409 8.9 216,098 9.3 43,882 96.6% $2,997,916 97.2% $2,277,073 97.6% $1,024,550 2.1 67,229 2.2 53,910 2.4 39,377 1.3 19,225 0.6 1,068 0.0 100.0% $3,084,370 100.0% $2,332,051 100.0% $1,063,927 80.2% 12.0 4.1 96.3% 3.7 100.0% B. Net Revenues by Geographic Region (In thousands of $) 2015 2014 2013 2012 Dollars Percent Dollars Percent Dollars Percent Dollars Percent 93.7% 6.3 North America $3,455,737 International 454,161 Connected fitness 53,415 Total net revenues $3,963,313 87.2% $2.796,374 11.5 268.771 1.3 19.225 100.0% $3,084,370 90.7% $2,193,739 94.1% $ 997,816 8.7 138,312 5.9 66,111 0.6 1,068 0.0 100.0% $2,332,051 100.0% $1,063,927 100.0% Sources: Company 10-K reports, 2015, 2013, 2012 and 2010. Knowledge and Understanding The current ratio is a liquidity financial ratio and is calculated with Current Assets/Current Liabilities. A firm should have a minimum of 1.0, which means that the firm has sufficient current assets to cover its current liabilities. Application Calculate the current ratio - 200,000/100,000 = 2.0. This will demonstrate that you can locate the current assets and liabilities on the balance sheet to obtain the current ratio. Analysis Example: A trend analysis of the firm's current ratio indicates a 10% increase in the current ratio over the last five years, which has been driven by the firm converting its current liabilities into long-term debt. Synthesis Example: The firm's actions of converting its current liabilities to long-term debt, which has driven the current ratio to increase, is having a negative impact on its profitability of 10% due to the higher interest rate on the long-term debt. Evaluation Example: It is predicted that if this trend on the current ratio continues, the firm will experience a net loss within five years 
Step by Step Solution
There are 3 Steps involved in it
Step: 1

Get Instant Access to Expert-Tailored Solutions
See step-by-step solutions with expert insights and AI powered tools for academic success
Step: 2

Step: 3

Ace Your Homework with AI
Get the answers you need in no time with our AI-driven, step-by-step assistance
Get Started


