Answered step by step
Verified Expert Solution
Question
1 Approved Answer
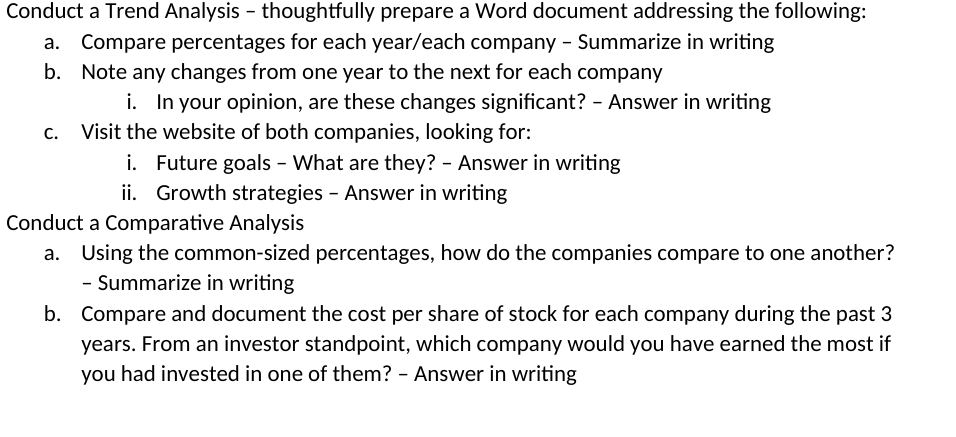
Conduct a Trend Analysis - thoughtfully prepare a Word document addressing the following: a. Compare percentages for each year/each company - Summarize in writing


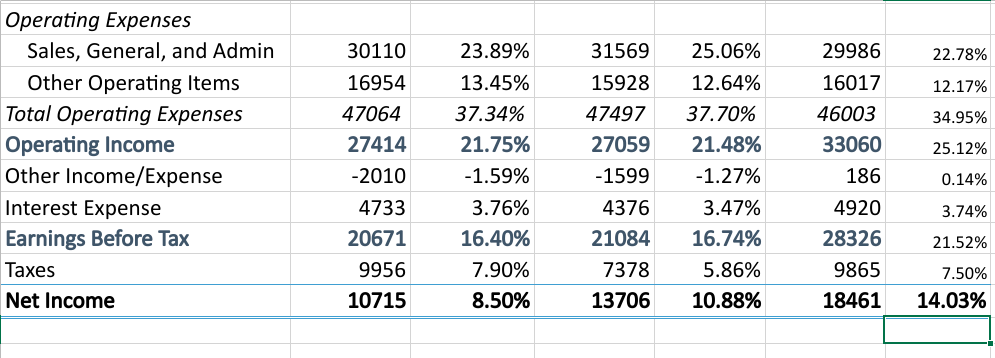
Conduct a Trend Analysis - thoughtfully prepare a Word document addressing the following: a. Compare percentages for each year/each company - Summarize in writing b. Note any changes from one year to the next for each company i. In your opinion, are these changes significant? - Answer in writing c. Visit the website of both companies, looking for: i. Future goals - What are they? - Answer in writing ii. Growth strategies - Answer in writing Conduct a Comparative Analysis a. Using the common-sized percentages, how do the companies compare to one another? - Summarize in writing b. Compare and document the cost per share of stock for each company during the past 3 years. From an investor standpoint, which company would you have earned the most if you had invested in one of them? - Answer in writing Operating Expenses Sales, General, and Admin Other Operating Items Total Operating Expenses Operating Income Other Income/Expense Interest Expense Earnings Before Tax Taxes Net Income 30110 16954 47064 27414 -2010 4733 20671 9956 10715 23.89% 13.45% 37.34% 21.75% -1.59% 3.76% 16.40% 7.90% 8.50% 31569 25.06% 15928 12.64% 47497 37.70% 27059 21.48% -1599 -1.27% 4376 3.47% 21084 16.74% 7378 5.86% 13706 10.88% 29986 16017 46003 33060 186 4920 28326 9865 18461 22.78% 12.17% 34.95% 25.12% 0.14% 3.74% 21.52% 7.50% 14.03% Conduct a Trend Analysis - thoughtfully prepare a Word document addressing the following: a. Compare percentages for each year/each company - Summarize in writing b. Note any changes from one year to the next for each company i. In your opinion, are these changes significant? - Answer in writing c. Visit the website of both companies, looking for: i. Future goals - What are they? - Answer in writing ii. Growth strategies - Answer in writing Conduct a Comparative Analysis a. Using the common-sized percentages, how do the companies compare to one another? - Summarize in writing b. Compare and document the cost per share of stock for each company during the past 3 years. From an investor standpoint, which company would you have earned the most if you had invested in one of them? - Answer in writing Operating Expenses Sales, General, and Admin Other Operating Items Total Operating Expenses Operating Income Other Income/Expense Interest Expense Earnings Before Tax Taxes Net Income 30110 16954 47064 27414 -2010 4733 20671 9956 10715 23.89% 13.45% 37.34% 21.75% -1.59% 3.76% 16.40% 7.90% 8.50% 31569 25.06% 15928 12.64% 47497 37.70% 27059 21.48% -1599 -1.27% 4376 3.47% 21084 16.74% 7378 5.86% 13706 10.88% 29986 16017 46003 33060 186 4920 28326 9865 18461 22.78% 12.17% 34.95% 25.12% 0.14% 3.74% 21.52% 7.50% 14.03%
Step by Step Solution
★★★★★
3.48 Rating (158 Votes )
There are 3 Steps involved in it
Step: 1
Here is the trend analysis comparing Company A and Company B in Word format Trend Analysis Company A vs Company B a Compare percentages for each yeareach company Summarize in writing Company A saw sli...
Get Instant Access to Expert-Tailored Solutions
See step-by-step solutions with expert insights and AI powered tools for academic success
Step: 2

Step: 3

Ace Your Homework with AI
Get the answers you need in no time with our AI-driven, step-by-step assistance
Get Started


