Answered step by step
Verified Expert Solution
Question
1 Approved Answer
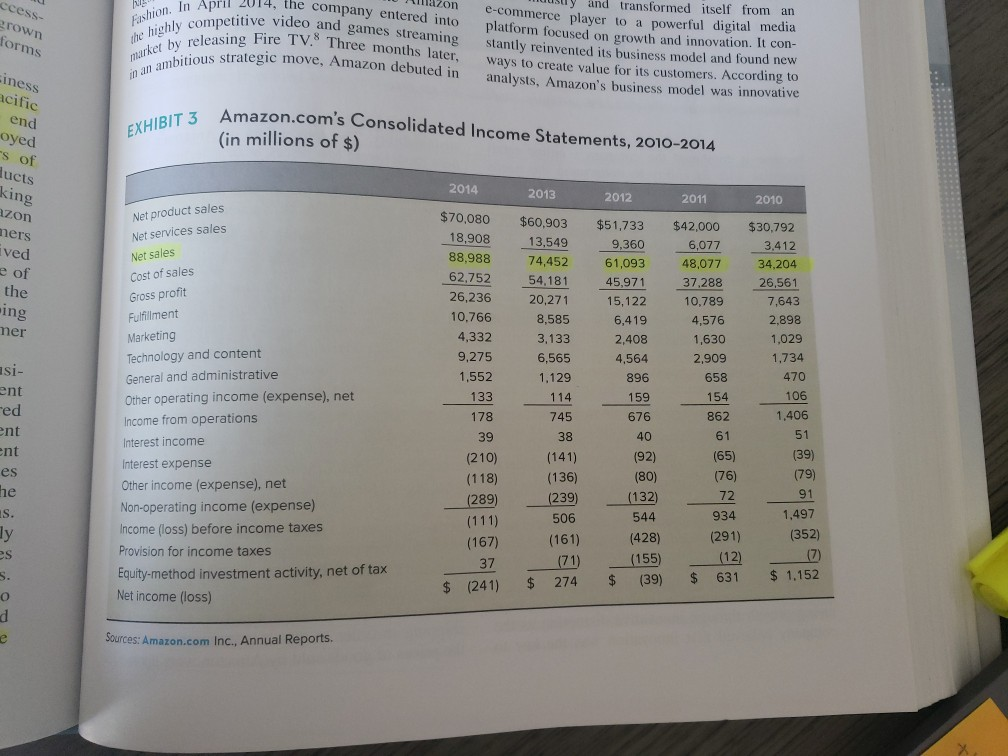
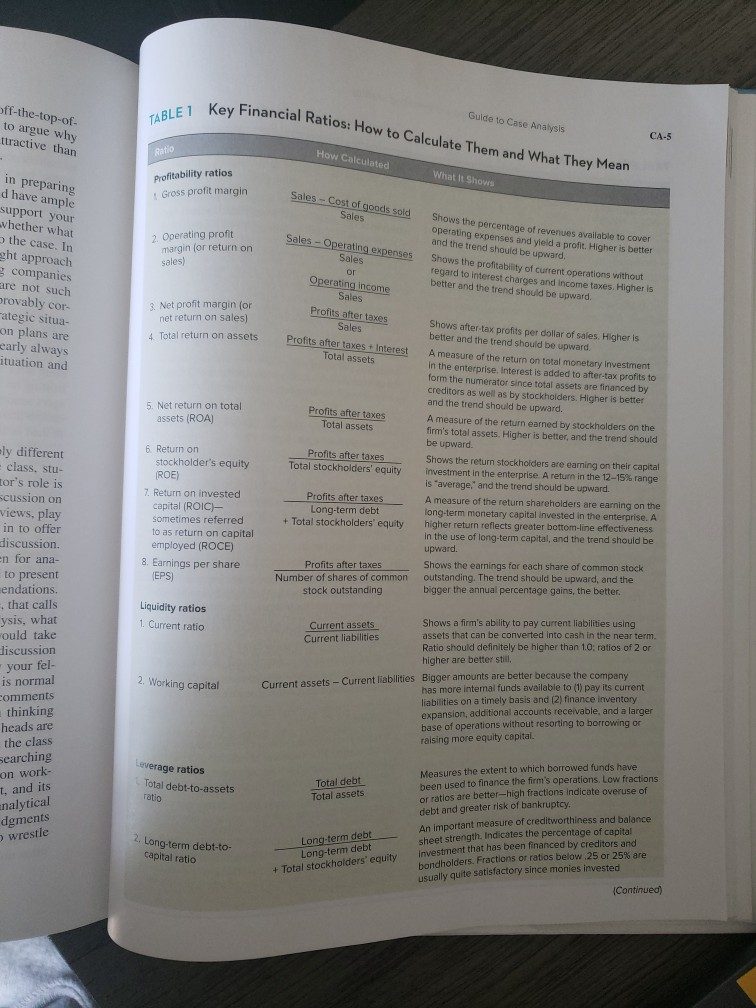
Conduct an income statement analysis and discussing change from year to year. use the appropriate formula to find gross profit margin and discuss the change


Conduct an income statement analysis and discussing change from year to year. use the appropriate formula to find gross profit margin and discuss the change year by year
ccess- arown forms Fashion. In A the highly competi zon In April 2014, the company entered into wompetitive video and games streaming asing Fire TV. Three months later, tious strategic move, Amazon debuted in musly and transformed itself from an e-commerce player to a powerful digital media platform focused on growth and innovation. It con- stantly reinvented its business model and found new ways to create value for its customers. According to analysts, Amazon's business model was innovative wurket by releasing Fire siness in an ambitious * acific end oyed -s of EXHIBIT 3 Am Amazon.com's Consolidated Income Statements, 2010-2014 (in millions of $) lucts king 2013 2012 2011 2010 azon mers ived of the 2014 $70,080 18,908 88,988 62,752 26,236 10.766 4,332 9,275 1,552 ing $60,903 13,549 74,452 54,181 20,271 8,585 3,133 6,565 1.129 114 $42,000 6,077 48,077 37.288 10,789 4,576 1,630 2,909 658 154 862 mer $51,733 9,360 61,093 45.971 15,122 6,419 2.408 4,564 896 159 676 40 (92) (80) (132) 544 $30,792 3.412 34,204 26,561 7,643 2,898 1,029 1,734 470 106 1,406 usi- Net product sales Net services sales Net sales Cost of sales Gross profit Fulfillment Marketing Technology and content General and administrative Other operating income (expense), net Income from operations Interest income Interest expense Other income (expense), net Non-operating income (expense) Income (oss) before income taxes Provision for income taxes Equity-method investment activity, net of tax Net income (loss) 133 ent red ent ent 745 61 51 (65) es (39) (79) (76) 178 39 (210) (118) (289) (111) (167) 37 (241) 72 38 (141) (136) (239) 506 (161) (71) 274 1,497 (352) (428) 934 (291) (12) 631 (155) (39) $ $ $ $ $ 1.152 Sources: Amazon.com Inc., Annual Reports. Key Financial Ratios: How to Calculate Them and What They Mean off-the-top-of- to argue why ttractive than TABLE1 Key Finan Guide to Case Analysis CA-5 Ratio How Calculated What It Shows Profitability ratios Gross profit margin Sales -- Cost of goods sold Sales in preparing d have ample support your whether what the case. In eht approach 2. Operating profit margin for return on sales) Sales - Operating expenses Sales Shows the percentage of revenues available to cover operating expenses and yield a profit. Higher is better and the trend should be upward. Shows the profitability of current operations without regard to interest charges and income taxes. Higher is better and the trend should be upward. companies are not such provably cor- rategic situa- on plans are early always ituation and Operating income Sales Profits after taxes 3 Net profit margin (or net return on sales) 4. Total return on assets Sales Profits after taxes + Interest Total assets 5. Net return on total assets (ROA) Profits after taxes Total assets Profits after taxes Total stockholders' equity 6. Return on stockholder's equity (ROE) 7. Return on invested capital (ROIC)- sometimes referred to as return on capital employed (ROCE) 8. Earnings per share (EPS) Shows after-tax profits per dollar of sales. Higher is better and the trend should be upward, A measure of the return on total monetary investment In the enterprise. Interest is added to after-tax profits to form the numerator since total assets are financed by creditors as well as by stockholders. Higher is better and the trend should be upward. A measure of the return earned by stockholders on the firm's total assets. Higher is better, and the trend should be upward. Shows the return stockholders are earning on their capital investment in the enterprise A return in the 12-15% range is "average, and the trend should be upward. A measure of the return shareholders are earning on the long-term monetary capital invested in the enterprise. A higher return reflects greater bottom-line effectiveness in the use of long-term capital, and the trend should be upward. Shows the earnings for each share of common stock outstanding. The trend should be upward, and the bigger the annual percentage gains, the better. Profits after taxes Long-term debt + Total stockholders' equity Profits after taxes Number of shares of common stock outstanding Liquidity ratios 1. Current ratio ly different class. stu- tor's role is Scussion on views, play in to offer discussion en for ana- to present endations. that calls ysis, what would take discussion your fel- is normal comments thinking heads are the class Searching on work- 1, and its analytical dgments wrestle 2. Working capital Current assets Shows a firm's ability to pay current liabilities using Current liabilities assets that can be converted into cash in the near term. Ratio should definitely be higher than 1.0, ratios of 2 or higher are better still Current assets - Current liabilities Bigger amounts are better because the company has more internal funds available to (1) pay its current liabilities on a timely basis and (2) finance inventory expansion, additional accounts receivable, and a larger base of operations without resorting to borrowing or raising more equity capital Leverage ratios Total debt-to-assets ratio Total debt Total assets Measures the extent to which borrowed funds have been used to finance the firm's operations. Low fractions or ratios are better-high fractions indicate overuse of debt and greater risk of bankruptcy. An important measure of creditworthiness and balance sheet strength. Indicates the percentage of capital Investment that has been financed by creditors and bondholders. Fractions or ratios below.25 or 25% are usually quite satisfactory since monies invested Long-term debt-to- capital ratio Long-term debt Long-term debt + Total stockholders' equity Continued)Step by Step Solution
There are 3 Steps involved in it
Step: 1

Get Instant Access to Expert-Tailored Solutions
See step-by-step solutions with expert insights and AI powered tools for academic success
Step: 2

Step: 3

Ace Your Homework with AI
Get the answers you need in no time with our AI-driven, step-by-step assistance
Get Started


