

Answered step by step
Verified Expert Solution
Question
1 Approved Answer
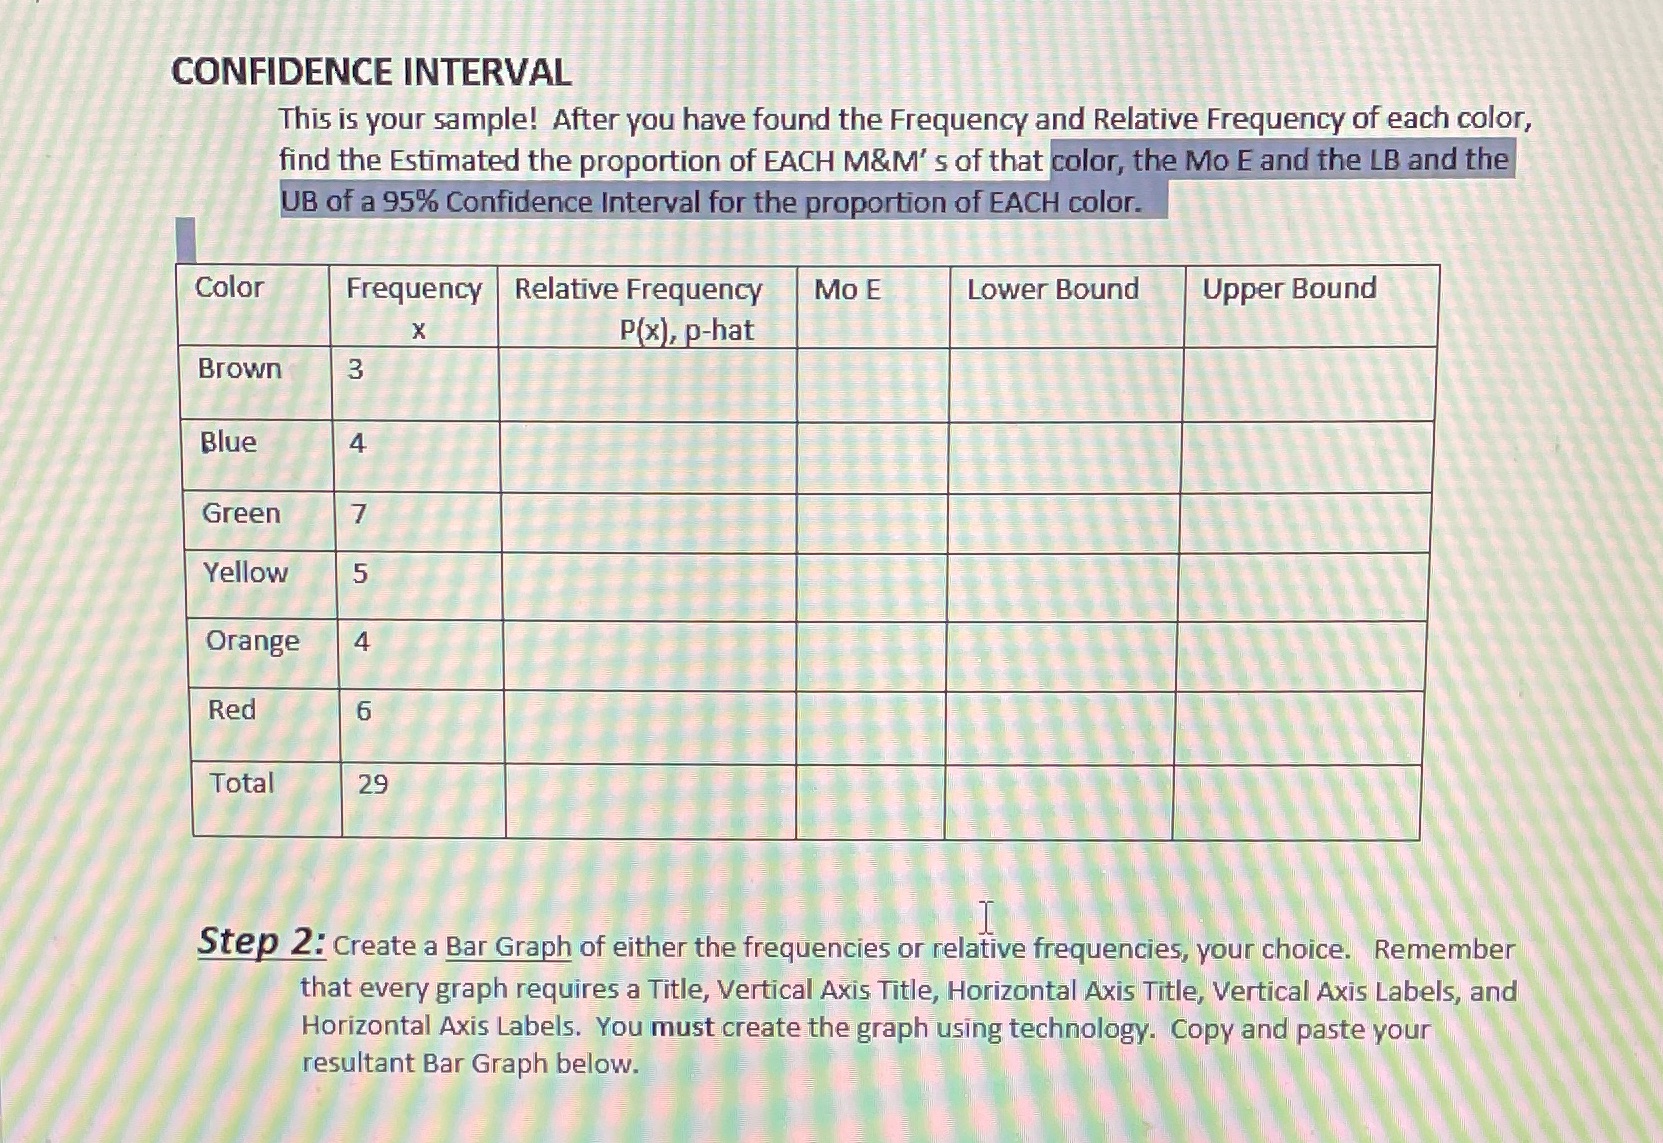
CONFIDENCE INTERVAL This is your sample! After you have found the Frequency and Relative Frequency of each color, find the Estimated the proportion of EACH
Step by Step Solution
There are 3 Steps involved in it
Step: 1

Get Instant Access to Expert-Tailored Solutions
See step-by-step solutions with expert insights and AI powered tools for academic success
Step: 2

Step: 3
Ace Your Homework with AI
Get the answers you need in no time with our AI-driven, step-by-step assistance
Get Started
Finite Math And Applied Calculus
Authors: Stefan Waner, Steven Costenoble
7th Edition
1337515566, 9781337515566