Question
Consider a company that designs, produces, and sells summer fashion items such as swimsuits. About 6 months before summer, the company must commit itself to
Consider a company that designs, produces, and sells summer fashion items such as swimsuits. About 6 months before summer, the company must commit itself to speci?c production quantities for all its products. Since there is no clear indication of how the market will respond to the new designs, the company needs to use various tools to predict demand for each design, and plan production and supply accordingly. In this setting, the trade-offs are clear: Overestimating customer demand will result in unsold inventory, whereas underestimating customer demand will lead to inventory stockouts and loss of potential customers.
To assist management in these decisions, the marketing department uses historical data from the last 5 years, current economic conditions, and other factors to construct a probabilistic forecast of the demand for swimsuits. They have identi?ed several possible scenarios for sales in the coming season, based on such factors as possible weather patterns and competitors' behavior, and assigned each a probability, or chance of occurring. The distribution of the demand is as follows: the probability that the demand is equal to 8000,10000,12000,14000,16000,18000 are 0.1,0.1,0.2,0.35,0.15,0.1, respectively.

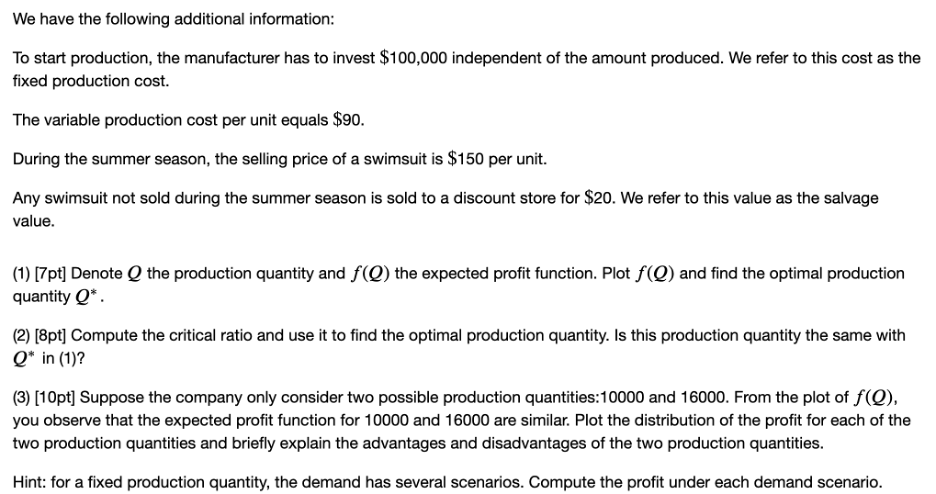
We have the following additional information: To start production, the manufacturer has to invest $100,000 independent of the amount produced. We refer to this cost as the fixed production cost. The variable production cost per unit equals $90. During the summer season, the selling price of a swimsuit is $150 per unit. Any swimsuit not sold during the summer season is sold to a discount store for $20. We refer to this value as the salvage value. (1) [7pt] Denote Q the production quantity and f(Q) the expected profit function. Plot f(Q) and find the optimal production quantity Q*. (2) [8pt] Compute the critical ratio and use it to find the optimal production quantity. Is this production quantity the same with Q* in (1)? (3) [10pt] Suppose the company only consider two possible production quantities:10000 and 16000. From the plot of f(Q), you observe that the expected profit function for 10000 and 16000 are similar. Plot the distribution of the profit for each of the two production quantities and briefly explain the advantages and disadvantages of the two production quantities. Hint: for a fixed production quantity, the demand has several scenarios. Compute the profit under each demand scenario.
Step by Step Solution
There are 3 Steps involved in it
Step: 1

Get Instant Access to Expert-Tailored Solutions
See step-by-step solutions with expert insights and AI powered tools for academic success
Step: 2

Step: 3

Ace Your Homework with AI
Get the answers you need in no time with our AI-driven, step-by-step assistance
Get Started


