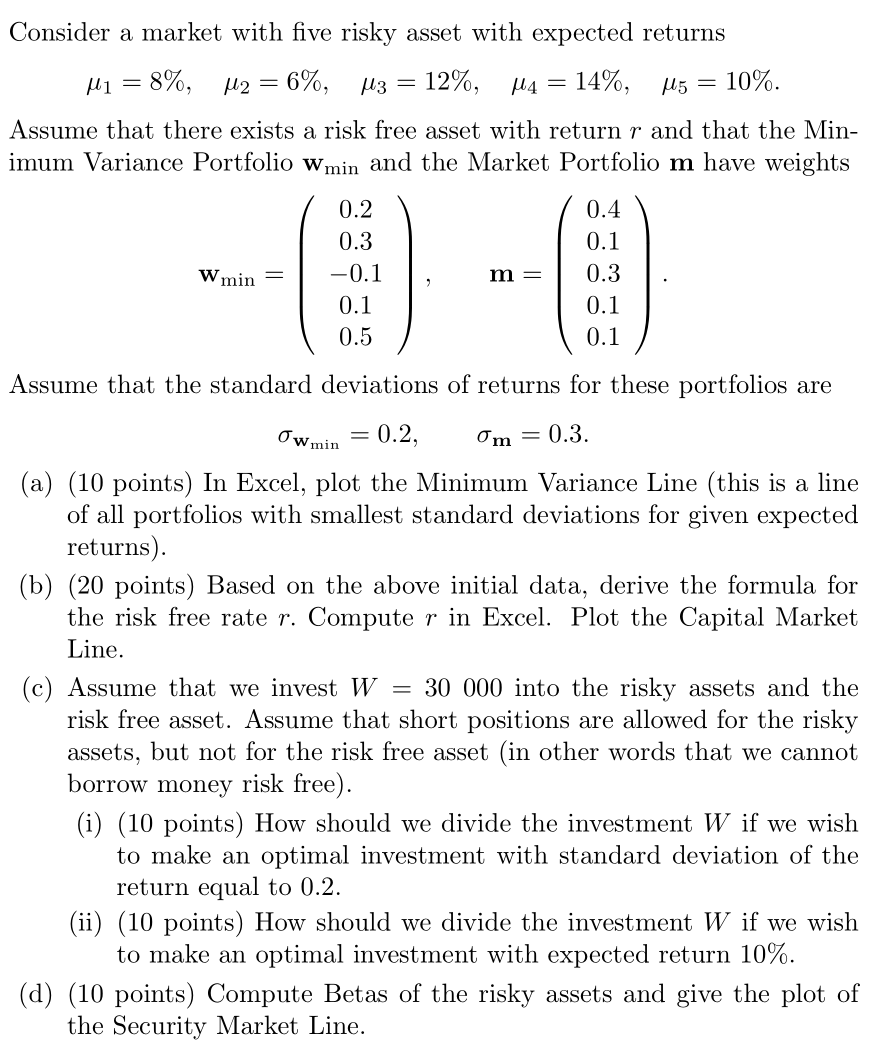
Consider a market with five risky asset with expected returns M1 = 8%, M2 = 6%, 3 12%, M4 = 14%, 115 10%. Assume that there exists a risk free asset with return r and that the Min- imum Variance Portfolio Wmin and the Market Portfolio m have weights 0.2 0.3 -0.1 0.4 0.1 W min m = 0.3 0.1 0.5 0.1 0.1 Assume that the standard deviations of returns for these portfolios are Owmin = 0.2, Om = 0.3. (a) (10 points) In Excel, plot the Minimum Variance Line (this is a line of all portfolios with smallest standard deviations for given expected returns). (b) (20 points) Based on the above initial data, derive the formula for the risk free rate r. Compute r in Excel. Plot the Capital Market Line. (c) Assume that we invest W = 30 000 into the risky assets and the risk free asset. Assume that short positions are allowed for the risky assets, but not for the risk free asset (in other words that we cannot borrow money risk free). (i) (10 points) How should we divide the investment W if we wish to make an optimal investment with standard deviation of the return equal to 0.2. (ii) (10 points) How should we divide the investment W if we wish to make an optimal investment with expected return 10%. (d) (10 points) Compute Betas of the risky assets and give the plot of the Security Market Line. Consider a market with five risky asset with expected returns M1 = 8%, M2 = 6%, 3 12%, M4 = 14%, 115 10%. Assume that there exists a risk free asset with return r and that the Min- imum Variance Portfolio Wmin and the Market Portfolio m have weights 0.2 0.3 -0.1 0.4 0.1 W min m = 0.3 0.1 0.5 0.1 0.1 Assume that the standard deviations of returns for these portfolios are Owmin = 0.2, Om = 0.3. (a) (10 points) In Excel, plot the Minimum Variance Line (this is a line of all portfolios with smallest standard deviations for given expected returns). (b) (20 points) Based on the above initial data, derive the formula for the risk free rate r. Compute r in Excel. Plot the Capital Market Line. (c) Assume that we invest W = 30 000 into the risky assets and the risk free asset. Assume that short positions are allowed for the risky assets, but not for the risk free asset (in other words that we cannot borrow money risk free). (i) (10 points) How should we divide the investment W if we wish to make an optimal investment with standard deviation of the return equal to 0.2. (ii) (10 points) How should we divide the investment W if we wish to make an optimal investment with expected return 10%. (d) (10 points) Compute Betas of the risky assets and give the plot of the Security Market Line


