Answered step by step
Verified Expert Solution
Question
1 Approved Answer
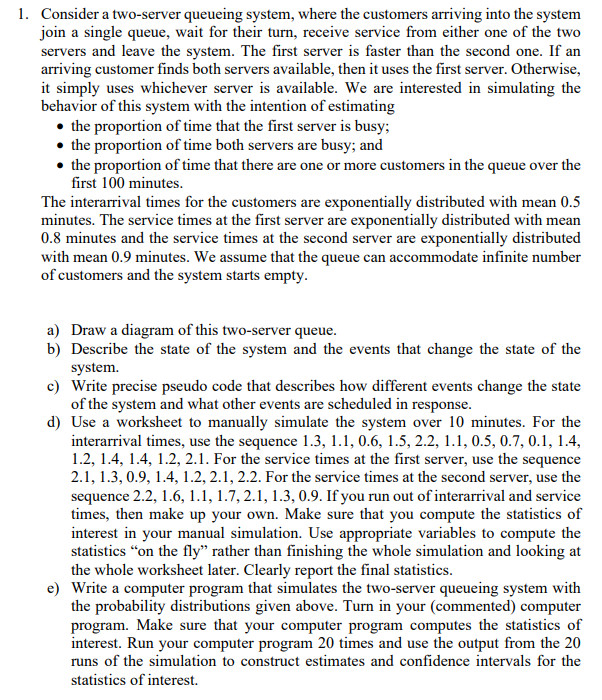
Consider a two - server queueing system, where the customers arriving into the system join a single queue, wait for their turn, receive service from
Consider a twoserver queueing system, where the customers arriving into the system
join a single queue, wait for their turn, receive service from either one of the two
servers and leave the system. The first server is faster than the second one. If an
arriving customer finds both servers available, then it uses the first server. Otherwise,
it simply uses whichever server is available. We are interested in simulating the
behavior of this system with the intention of estimating
the proportion of time that the first server is busy;
the proportion of time both servers are busy; and
the proportion of time that there are one or more customers in the queue over the
first minutes.
The interarrival times for the customers are exponentially distributed with mean
minutes. The service times at the first server are exponentially distributed with mean
minutes and the service times at the second server are exponentially distributed
with mean minutes. We assume that the queue can accommodate infinite number
of customers and the system starts empty.
a Draw a diagram of this twoserver queue.
b Describe the state of the system and the events that change the state of the
system.
c Write precise pseudo code that describes how different events change the state
of the system and what other events are scheduled in response.
d Use a worksheet to manually simulate the system over minutes. For the
interarrival times, use the sequence
For the service times at the first server, use the sequence
For the service times at the second server, use the
sequence If you run out of interarrival and service
times, then make up your own. Make sure that you compute the statistics of
interest in your manual simulation. Use appropriate variables to compute the
statistics on the fly" rather than finishing the whole simulation and looking at
the whole worksheet later. Clearly report the final statistics.
e Write a computer program that simulates the twoserver queueing system with
the probability distributions given above. Turn in your commented computer
program. Make sure that your computer program computes the statistics of
interest. Run your computer program times and use the output from the
runs of the simulation to construct estimates and confidence intervals for the
statistics of interest.

Step by Step Solution
There are 3 Steps involved in it
Step: 1

Get Instant Access to Expert-Tailored Solutions
See step-by-step solutions with expert insights and AI powered tools for academic success
Step: 2

Step: 3

Ace Your Homework with AI
Get the answers you need in no time with our AI-driven, step-by-step assistance
Get Started


