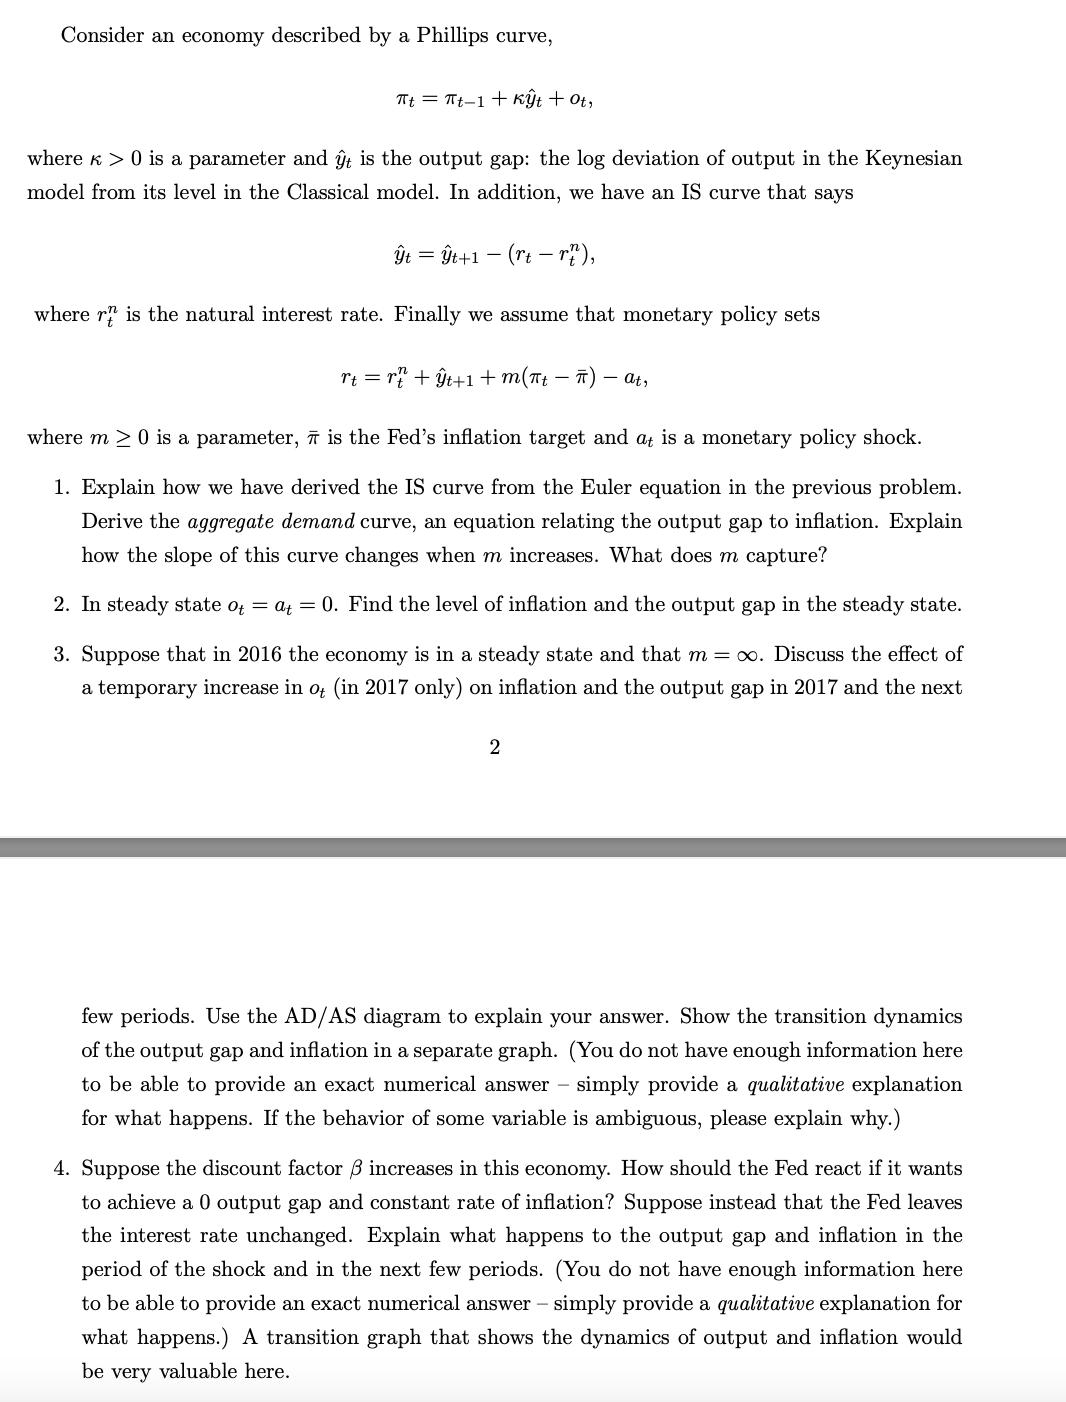
Consider an economy described by a Phillips curve, Tt = t_1+rt to, where > 0 is...
Fantastic news! We've Found the answer you've been seeking!
Question:
Transcribed Image Text:
Consider an economy described by a Phillips curve, Tt = t_1+rật to, where > 0 is a parameter and ŷt is the output gap: the log deviation of output in the Keynesian model from its level in the Classical model. In addition, we have an IS curve that says ŷt = ŷt+1 (rt-rt), where r is the natural interest rate. Finally we assume that monetary policy sets rt = rf +ŷt+1+m(πt - π) - at, where m > 0 is a parameter, is the Fed's inflation target and at is a monetary policy shock. 1. Explain how we have derived the IS curve from the Euler equation in the previous problem. Derive the aggregate demand curve, an equation relating the output gap to inflation. Explain how the slope of this curve changes when m increases. What does m capture? 2. In steady state ot = at = 0. Find the level of inflation and the output gap in the steady state. 3. Suppose that in 2016 the economy is in a steady state and that m = ∞. Discuss the effect of a temporary increase in ot (in 2017 only) on inflation and the output gap in 2017 and the next 2 few periods. Use the AD/AS diagram to explain your answer. Show the transition dynamics of the output gap and inflation in a separate graph. (You do not have enough information here to be able to provide an exact numerical answer - simply provide a qualitative explanation for what happens. If the behavior of some variable is ambiguous, please explain why.) 4. Suppose the discount factor 3 increases in this economy. How should the Fed react if it wants to achieve a 0 output gap and constant rate of inflation? Suppose instead that the Fed leaves the interest rate unchanged. Explain what happens to the output gap and inflation in the period of the shock and in the next few periods. (You do not have enough information here to be able to provide an exact numerical answer - simply provide a qualitative explanation for what happens.) A transition graph that shows the dynamics of output and inflation would be very valuable here. Consider an economy described by a Phillips curve, Tt = t_1+rật to, where > 0 is a parameter and ŷt is the output gap: the log deviation of output in the Keynesian model from its level in the Classical model. In addition, we have an IS curve that says ŷt = ŷt+1 (rt-rt), where r is the natural interest rate. Finally we assume that monetary policy sets rt = rf +ŷt+1+m(πt - π) - at, where m > 0 is a parameter, is the Fed's inflation target and at is a monetary policy shock. 1. Explain how we have derived the IS curve from the Euler equation in the previous problem. Derive the aggregate demand curve, an equation relating the output gap to inflation. Explain how the slope of this curve changes when m increases. What does m capture? 2. In steady state ot = at = 0. Find the level of inflation and the output gap in the steady state. 3. Suppose that in 2016 the economy is in a steady state and that m = ∞. Discuss the effect of a temporary increase in ot (in 2017 only) on inflation and the output gap in 2017 and the next 2 few periods. Use the AD/AS diagram to explain your answer. Show the transition dynamics of the output gap and inflation in a separate graph. (You do not have enough information here to be able to provide an exact numerical answer - simply provide a qualitative explanation for what happens. If the behavior of some variable is ambiguous, please explain why.) 4. Suppose the discount factor 3 increases in this economy. How should the Fed react if it wants to achieve a 0 output gap and constant rate of inflation? Suppose instead that the Fed leaves the interest rate unchanged. Explain what happens to the output gap and inflation in the period of the shock and in the next few periods. (You do not have enough information here to be able to provide an exact numerical answer - simply provide a qualitative explanation for what happens.) A transition graph that shows the dynamics of output and inflation would be very valuable here.
Expert Answer:
Answer rating: 100% (QA)
The Phillips curve is an economic concept that describes the inverse relationship between unemployment and inflation in an economy In the short run when unemployment is high there is little pressure o... View the full answer
Related Book For
Macroeconomics
ISBN: 978-1464168505
5th Canadian Edition
Authors: N. Gregory Mankiw, William M. Scarth
Posted Date:
Students also viewed these economics questions
-
-Your 40 year aunt wants to start saving for her retirement. She expects to retire at 65. She thinks that she will have saved $500,000 by the time she retires. She expects of live to 90. a) How much...
-
1. In the classical model, it is thought that the long-run: A. and short-run aggregate supply curves are both upward sloping. B. aggregate supply curve is vertical and the short-run aggregate supply...
-
What is the result (compile-time error, run-time error, no error) of line 11? 1 public interface IInterface {} public class A implements IInterface {...} public class B implements IInterface {...}...
-
The RRR Company has a target current ratio of 2.4. Presently, the current ratio is 3.3 based on current assets of $6,567,000. If RRR expands its inventory using short- term liabilities (maturities...
-
How does language complicate the tasks of global marketers?
-
From the Baseball Almanac website, we found the heights, in inches, of the players on the 2012 World Series runner-up Detroit Tigers baseball team. a. Construct a stem-and-leaf diagram of these data...
-
Compute profitability ratios (Learning Objective 4) Compute four ratios that measure Bonapartes ability to earn profits. The companys comparative income statement follows. The data for 2004 are given...
-
Gordeeva Corporation began selling goods on the installment basis on January 1, 2010. During 2010, Gordeeva had installment sales of $150,000; cash collections of $54,000; cost of installment sales...
-
Part 2 : Problems Prepare journal entries to record the following transactions for Emerson Corporation. Note: If no entry is required for a transaction / event , select " No journal entry required"...
-
If y represents total earnings in dollars and x represents hours worked, then which equation models the wages of someone who makes $6.25 an hour?
-
Convert 15.3 m3 to liters. Note that 1 mL = 1 cm3. First,convert cubic meters to cubic centimeters, which is equal to thenumber of milliliters. Then convert milliliters to liters.
-
A very common type of debt is a mortgage of a home. One form of protection is mortgage insurance. Explain what this is and who is protected.Under pure expectation theory, what would be the 4-year...
-
Lays, in its new marketing strategy, challenged consumers to propose new creative flavors for potato chips. This challenge caught on in such a way that 3.8 million new flavors emerged in 3 months....
-
The government of Canada settled 25,000 government-sponsored Syrian refugees in Canada in a very short period of time ending in February, 2017. Often, these people were forced to leave their homes...
-
1. Define preferred stock and outline its distinctive features, including fixed dividends and higher claim on assets. 2. Explain the lower risk associated with preferred stocks compared to common...
-
Briefly discuss the role of marketing communications in value creation. Why are marketing communications so important?
-
Triangular arbitrage: Price of a US dollar in Geneva is 1.0204-1030. Price of a US dollar in Japan is 99.8877-9876. Indirect Swiss franc for yen quote is 100.2468-3579. What is percentage return from...
-
Describe the Operations (+,,*,/) that can cause negligible addition (NA), error magnification (EM), or subtractive cancellation (SC) in calculating ?((x^2)+1) - x . Give the range of where they might...
-
In the MundellFleming model with floating exchange rates, explain what happens to aggregate income, the exchange rate, and the trade balance when the money supply is reduced. What would happen if...
-
If Japan has low inflation and Mexico has high inflation, what will happen to the exchange rate between the Japanese yen and the Mexican peso?
-
The U.S. money supply fell during the years 1929 to 1933 because both the currencydeposit ratio and the reservedeposit ratio increased. Use the model of the money supply and the data in Table 19-1 to...
-
When a lease is classified as an operating lease, a. the lease liability should be presented on the balance sheet of the lessee. b. the lease liability should be presented on the balance sheet of the...
-
When an investor views the debt-to-equity ratio of a company, a. it is a measure of the companys liquidity. b. a high value is generally viewed favorably. c. a low value is generally viewed...
-
When an investor views the times interest earned ratio of a company, a. it is a measure of the companys liquidity. b. a high value is generally viewed favorably. c. a low value is generally viewed...
Study smarter with the SolutionInn App