Answered step by step
Verified Expert Solution
Link Copied!

Question

1 Approved Answer

Consider Figure D (below). Figure D Body Mass Index O 10 15 20 25 Years of School C. (2 pts.) Using only the data points
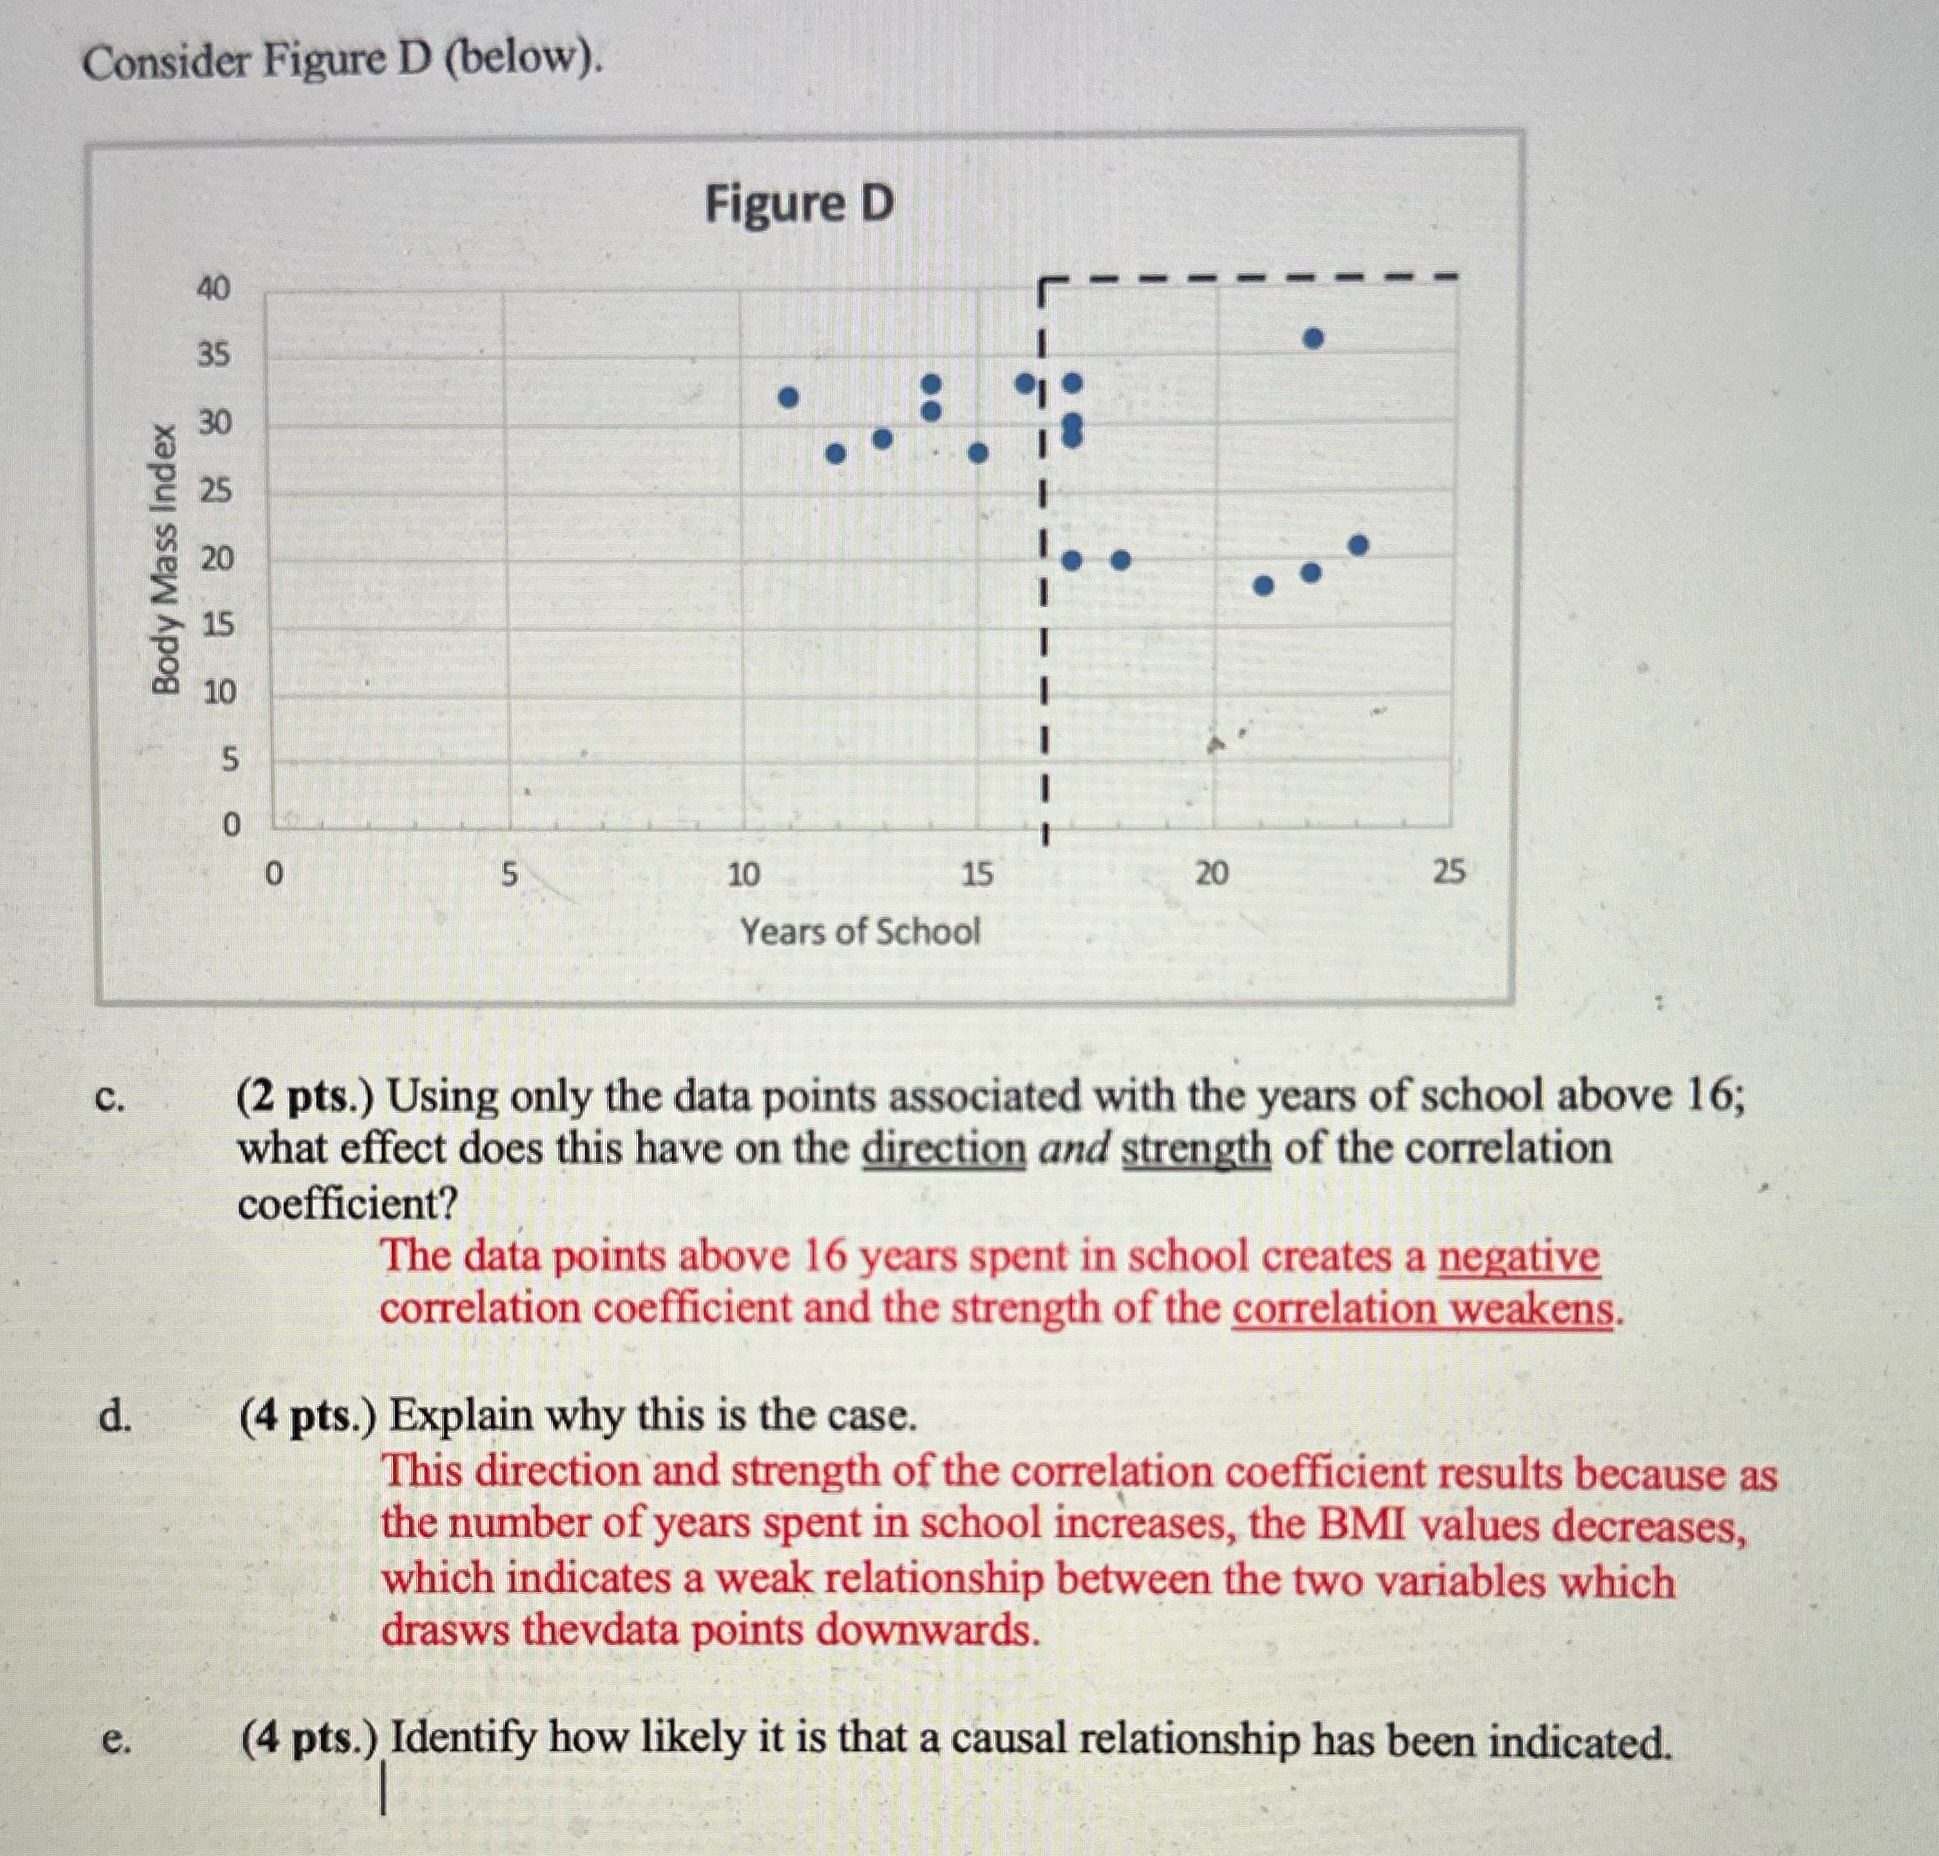
image text in transcribed
Consider Figure D (below). Figure D Body Mass Index O 10 15 20 25 Years of School C. (2 pts.) Using only the data points associated with the years of school above 16; what effect does this have on the direction and strength of the correlation coefficient? The data points above 16 years spent in school creates a negative correlation coefficient and the strength of the correlation weakens. d. (4 pts.) Explain why this is the case. This direction and strength of the correlation coefficient results because as the number of years spent in school increases, the BMI values decreases, which indicates a weak relationship between the two variables which drasws thevdata points downwards. e. (4 pts.) Identify how likely it is that a causal relationship has been indicated

Step by Step Solution

There are 3 Steps involved in it

Step: 1

blur-text-image

Get Instant Access to Expert-Tailored Solutions

See step-by-step solutions with expert insights and AI powered tools for academic success

Step: 2

blur-text-image

Step: 3

blur-text-image

Ace Your Homework with AI

Get the answers you need in no time with our AI-driven, step-by-step assistance

Get Started

Recommended Textbook for

Mathematical Interest Theory

Authors: Leslie Jane, James Daniel, Federer Vaaler

3rd Edition

147046568X, 978-1470465681

More Books

Students also viewed these Mathematics questions

Question

\f

Answered: 1 week ago

Question

For the set of data below, determine the mean: 20, 25, 25, 29, 31

Answered: 1 week ago