Question
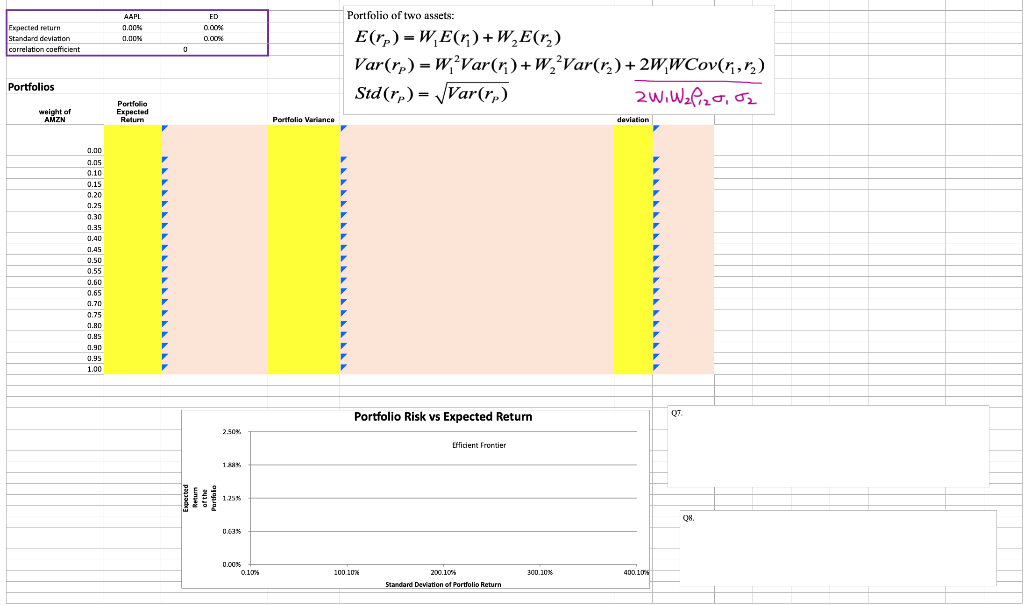
Consider forming portfolios with these two assets. Let the weight of AAPL in the portfolio vary and take values between 0%-100% with increments of 5%.

Consider forming portfolios with these two assets. Let the weight of AAPL in the portfolio vary and take values between 0%-100% with increments of 5%. In other words, the weight of AAPL can be 0%, 5%, 10%,..95%,100%. The weight of ED is simply 100% minus weight of AAPL. Calculate the monthly average return, return variance and standard deviation of portfolios for all possible weights. (2pts)
Plot monthly average return versus monthly standard deviation values that you find in 5 to get the feasible set with these two stocks and title it as "Portfolio Risk vs Expected Return". Note: The average return should be y-axis and standard deviation should be x- axis (1.5 points)
Can all the portfolios on the feasible set be chosen by the investors? Why/ Why not? Which portion of the feasible set is the efficient frontier? Write your answer in a text box. (1pt)
How does the correlation between AAPL and ED effect the shape of the feasible set? For example, how would it look like if the two stocks were perfectly positively correlated (i.e. =1) or how would it look like if they were perfectly negatively correlated (i.e. =-1)? When do we have no diversification benefits? When do we have the maximum diversification benefits? Write your answer in a text box. (1.5pts)
Portfolio of two assets: AAPL 0.00% 0.00% % ED 0.00 Expected return Standard deviation correlation coefficient 0.00 0 E(rp) = WE(r) +W E(r) Var(rp) - W, Var() +W, Var(rz) + 2W,WCov(ri,r) Std (rp)= Var(rp) 2w.Wzlizo, Portfolios weight of AMZN Portfolio Expected Return Portfolio Variance deviation 0.00 0.05 0.10 0.15 0.20 0.25 0.30 0.35 0.40 0.45 0.50 0.55 0.60 0.65 0.70 0.75 0.80 0.85 0.90 0.95 1.00 Portfolio Risk vs Expected Return 07 2.504 Efficient Frontier 1.21 1.25% 08 0.63% 0.00% % 0.10 % 100.10% 300.10% 400.104 Standard Deviation of Portfolio Return Portfolio of two assets: AAPL 0.00% 0.00% % ED 0.00 Expected return Standard deviation correlation coefficient 0.00 0 E(rp) = WE(r) +W E(r) Var(rp) - W, Var() +W, Var(rz) + 2W,WCov(ri,r) Std (rp)= Var(rp) 2w.Wzlizo, Portfolios weight of AMZN Portfolio Expected Return Portfolio Variance deviation 0.00 0.05 0.10 0.15 0.20 0.25 0.30 0.35 0.40 0.45 0.50 0.55 0.60 0.65 0.70 0.75 0.80 0.85 0.90 0.95 1.00 Portfolio Risk vs Expected Return 07 2.504 Efficient Frontier 1.21 1.25% 08 0.63% 0.00% % 0.10 % 100.10% 300.10% 400.104 Standard Deviation of Portfolio ReturnStep by Step Solution
There are 3 Steps involved in it
Step: 1

Get Instant Access to Expert-Tailored Solutions
See step-by-step solutions with expert insights and AI powered tools for academic success
Step: 2

Step: 3

Ace Your Homework with AI
Get the answers you need in no time with our AI-driven, step-by-step assistance
Get Started


