

Answered step by step
Verified Expert Solution
Question
1 Approved Answer
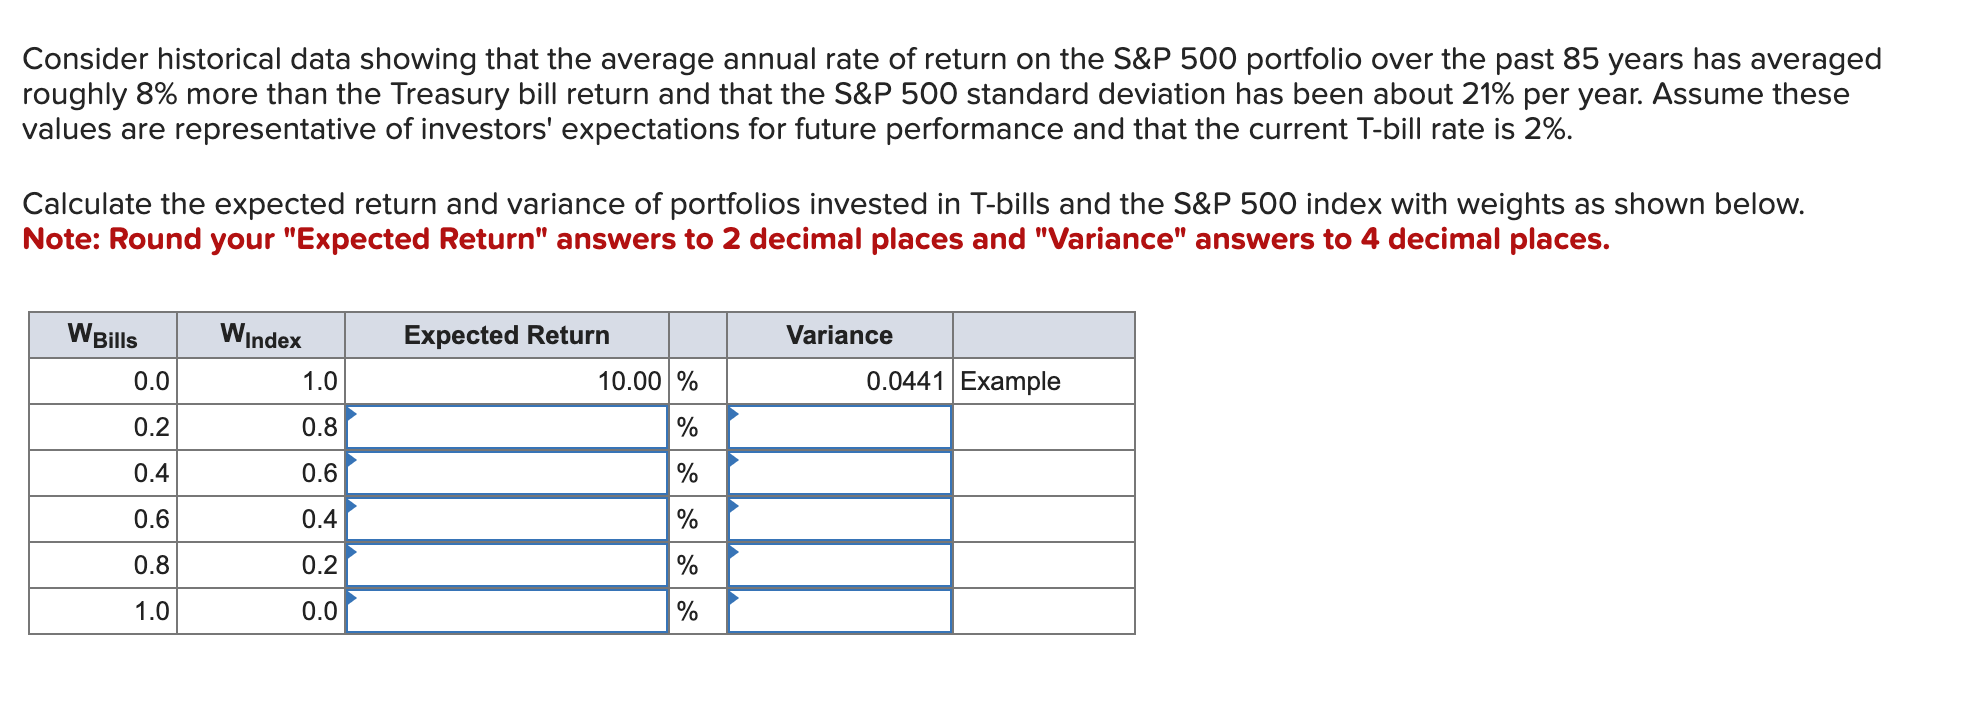
Consider historical data showing that the average annual rate of return on the S&P 5 0 0 portfolio over the past 8 5 years has
Consider historical data showing that the average annual rate of return on the S&P portfolio over the past years has averaged
roughly more than the Treasury bill return and that the S&P standard deviation has been about per year. Assume these
values are representative of investors' expectations for future performance and that the current Tbill rate is
Calculate the expected return and variance of portfolios invested in Tbills and the S&P index with weights as shown below.
Note: Round your "Expected Return" answers to decimal places and "Variance" answers to decimal places.
Step by Step Solution
There are 3 Steps involved in it
Step: 1

Get Instant Access to Expert-Tailored Solutions
See step-by-step solutions with expert insights and AI powered tools for academic success
Step: 2

Step: 3
Ace Your Homework with AI
Get the answers you need in no time with our AI-driven, step-by-step assistance
Get Started
Return Distributions In Finance
Authors: Stephen Satchell, John Knight
1st Edition
0750647515, 978-0750647519