

Answered step by step
Verified Expert Solution
Question
1 Approved Answer
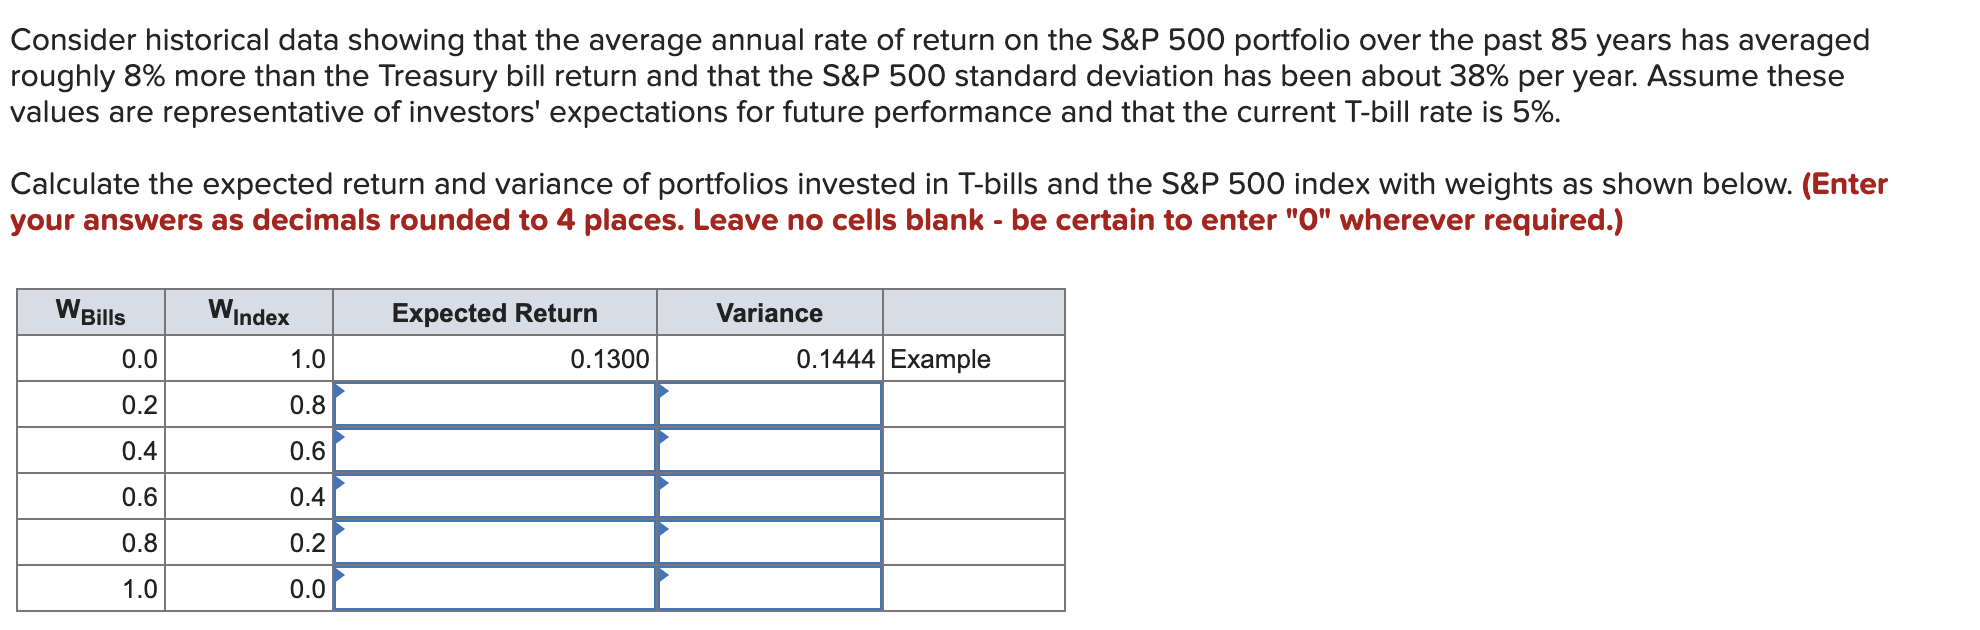
Consider historical data showing that the average annual rate of return on the S&P 500 portfolio over the past 85 years has averaged roughly 8%
Step by Step Solution
There are 3 Steps involved in it
Step: 1

Get Instant Access to Expert-Tailored Solutions
See step-by-step solutions with expert insights and AI powered tools for academic success
Step: 2

Step: 3
Ace Your Homework with AI
Get the answers you need in no time with our AI-driven, step-by-step assistance
Get Started
International Financial Management
Authors: Cheol S. Eun, Bruce G.Resnick
6th Edition
71316973, 978-0071316972, 78034655, 978-0078034657