

Answered step by step
Verified Expert Solution
Question
1 Approved Answer
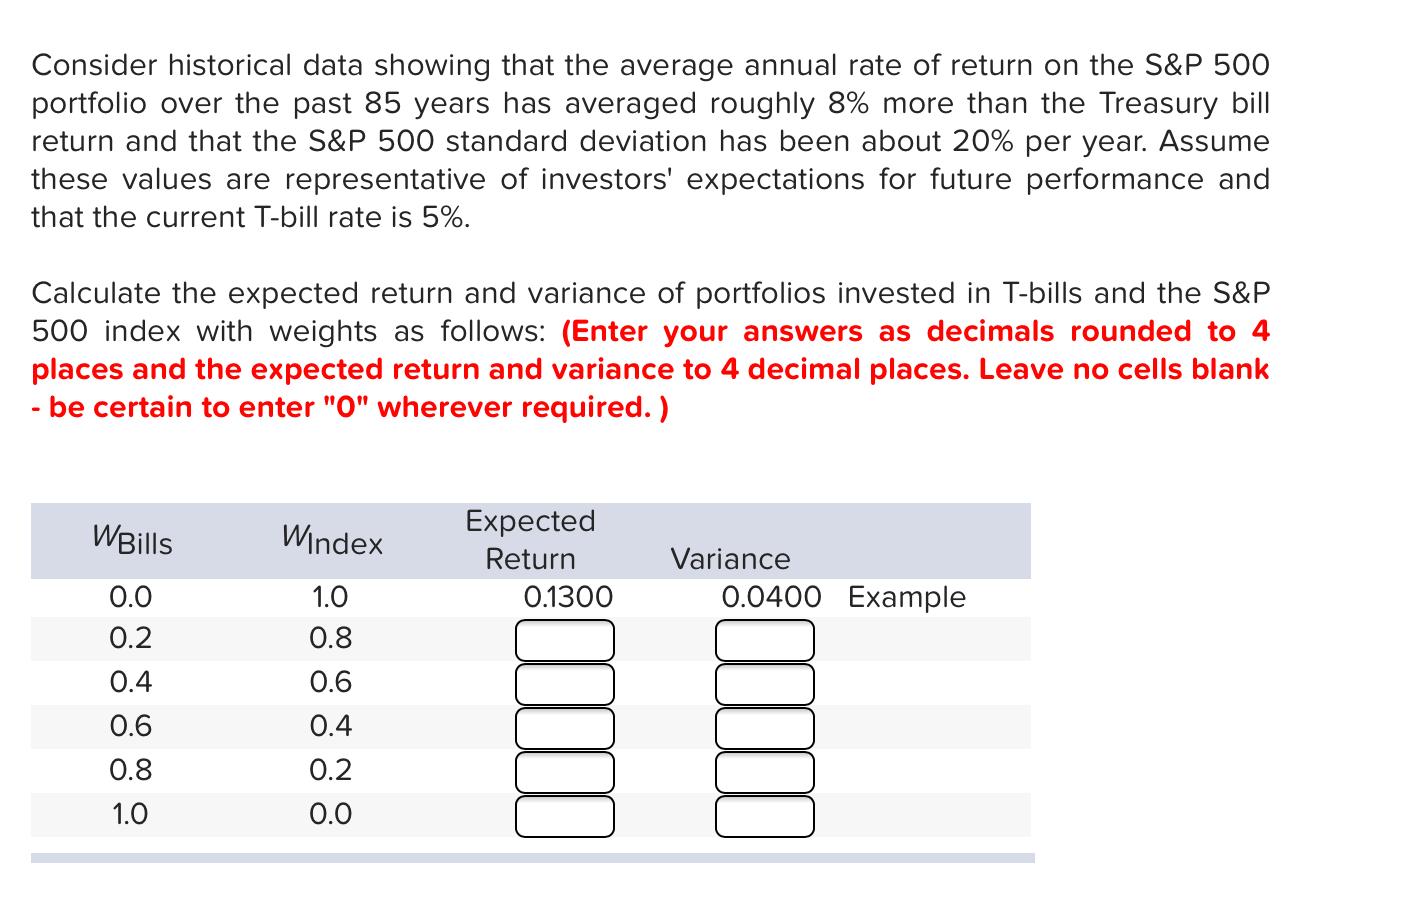
Consider historical data showing that the average annual rate of return on the S&P 500 portfolio over the past 85 years has averaged roughly 8%
Step by Step Solution
There are 3 Steps involved in it
Step: 1

Get Instant Access to Expert-Tailored Solutions
See step-by-step solutions with expert insights and AI powered tools for academic success
Step: 2

Step: 3
Ace Your Homework with AI
Get the answers you need in no time with our AI-driven, step-by-step assistance
Get Started
Money Talks Explaining How Money Really Works
Authors: Nina Bandelj ,Frederick F. Wherry ,Viviana A. Zelizer
1st Edition
0691202893, 978-0691202891