

Answered step by step
Verified Expert Solution
Question
1 Approved Answer
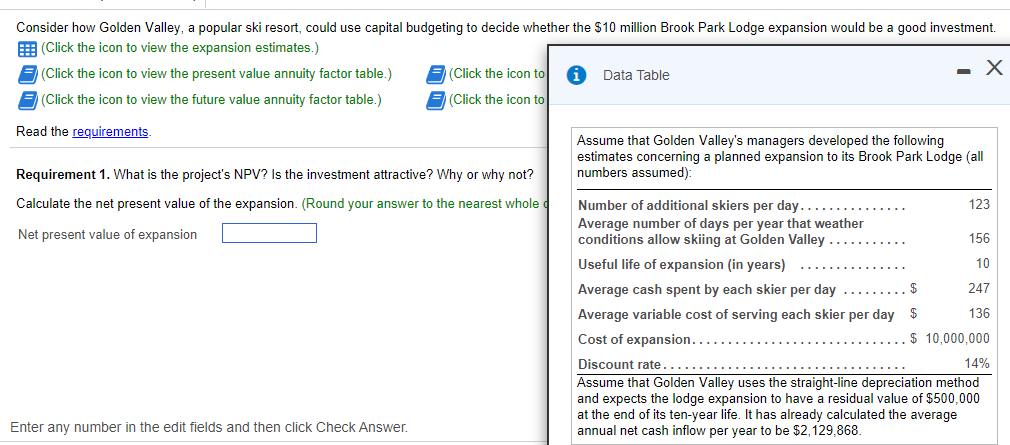
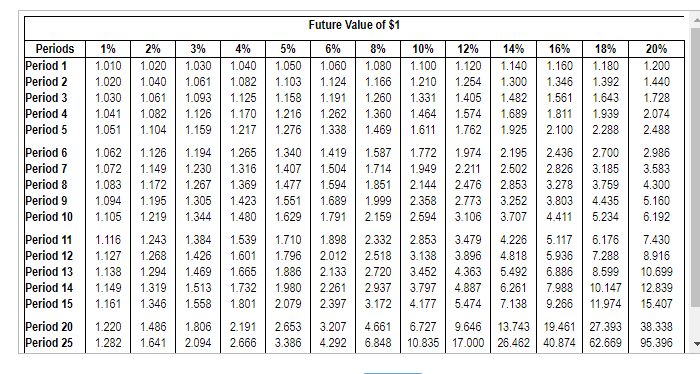
Consider how Golden Valley, a popular ski resort, could use capital budgeting to decide whether the $10 million Brook Park Lodge expansion would be a
Step by Step Solution
There are 3 Steps involved in it
Step: 1

Get Instant Access to Expert-Tailored Solutions
See step-by-step solutions with expert insights and AI powered tools for academic success
Step: 2

Step: 3
Ace Your Homework with AI
Get the answers you need in no time with our AI-driven, step-by-step assistance
Get Started
HR Audit Audit Your Most Precious Resources
Authors: DR. SIBRAM NISONKO
1st Edition
197357120X, 978-1973571209