Question
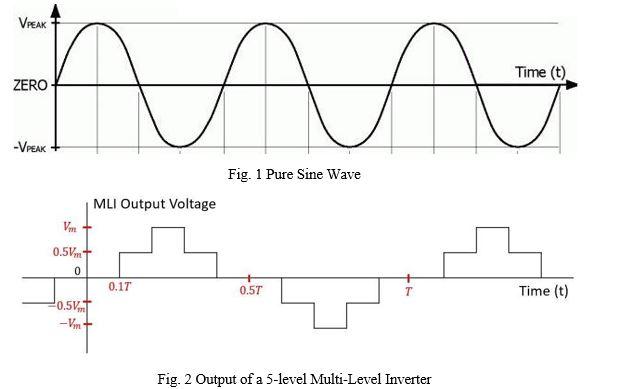
Consider the output of 5-level MLI as shown in Fig. 2, perform its frequency analysis for at least the first 40 harmonics. You may use
Consider the output of 5-level MLI as shown in Fig. 2, perform its frequency analysis for at least the first 40 harmonics. You may use MATLAB to give the plot of the first 40 harmonics. Also, highlight the harmonics which play no role. All mathematical work needs to be shown as well. Give mathematical form first, then plug in parameters for MATLAB.
Additional parameters to be put at the end of working. f=50 Hz, so you can find T. Vm=12.
Additional Remarks: (Tips)
- Fourier Transform will be a better option as the x-axis will already be a frequency axis.
- Follow basics, start working on it, focus on method and technique, and don't worry about results. -
You will find it much easier than it looks, once you start working on it.
• Write the signal in mathematical form for one period.
also, write Matlab code too

VrEAK Time (t) ZERO -VPEAK Fig. 1 Pure Sine Wave MLI Output Voltage Vm 0.5Vm 0.17 Time (t) 0.57 0.5V -Vm Fig. 2 Output of a 5-level Multi-Level Inverter
Step by Step Solution
3.40 Rating (159 Votes )
There are 3 Steps involved in it
Step: 1
clear clc clos...
Get Instant Access to Expert-Tailored Solutions
See step-by-step solutions with expert insights and AI powered tools for academic success
Step: 2

Step: 3

Ace Your Homework with AI
Get the answers you need in no time with our AI-driven, step-by-step assistance
Get Started


