Answered step by step
Verified Expert Solution
Question
1 Approved Answer
Consider the accompanying cash flow diagram represented below. Compute the equivalent annual worth at 10%. Years 54,000 54,000 510,00013.00$16.000 More Info The equivalent annual worth
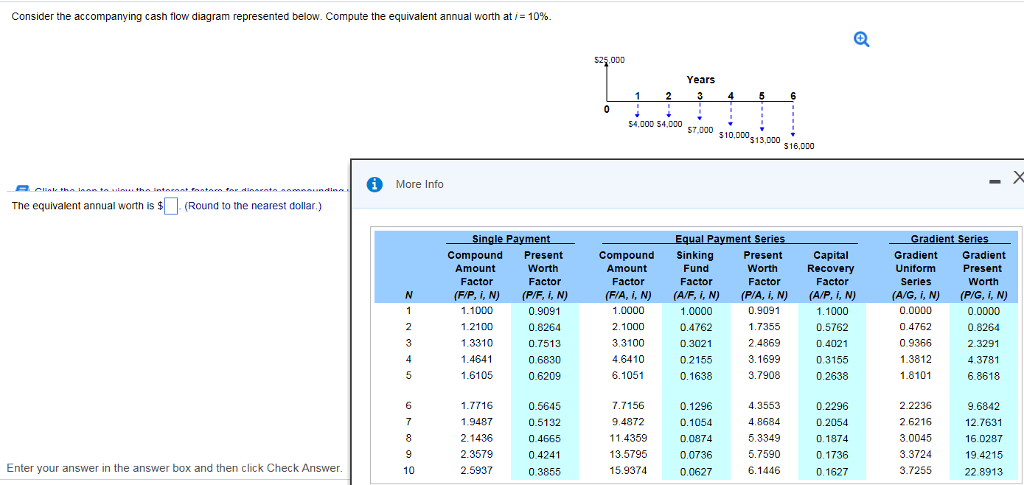
Consider the accompanying cash flow diagram represented below. Compute the equivalent annual worth at 10%. Years 54,000 54,000 510,00013.00$16.000 More Info The equivalent annual worth is (Round to the nearest dollar.) Compound Present Worth Factor Gradient Uniform Series Compound Sinking Amount Factor Fund Factor Present Worth Factor Capital Recovery Factor Gradient Present Wo rth Amount Factor (FIA, i, N) (A/F, i, N) (P/A, I, N) (A/P, i, N) 1.1000 1.2100 1.3310 1.4641 1.6105 0.9091 1.7355 2.4869 3.1699 3.7908 0.0000 0.4762 0.9366 1.3812 1.8101 0.0000 0.8264 2.3291 4.3781 6.8618 1.0000 0.9091 0.8264 0.7513 0.6830 0.6209 3.3100 4.6410 6.1051 1.0000 0.4762 0.3021 0.2155 0.1638 1.1000 0.5762 0.4021 0.3155 0.2638 7.7156 9.4872 11.4359 13.5795 15.9374 2.2236 2.6216 3.0045 3.3724 3.7255 0.5645 0.5132 0.1296 0.1054 0.0874 0.0736 0.0627 6 1.9487 2.1436 2.3579 2.5937 4.3553 4.8684 5.3349 5.7590 6.1446 0.2296 0.2054 0.1874 0.1736 0.1627 12.7631 16.0287 19.4215 22.8913 0.4241 0.3855 Enter your answer in the answer box and then click Check
Step by Step Solution
There are 3 Steps involved in it
Step: 1
Get Instant Access to Expert-Tailored Solutions
See step-by-step solutions with expert insights and AI powered tools for academic success
Step: 2
Step: 3
Ace Your Homework with AI
Get the answers you need in no time with our AI-driven, step-by-step assistance
Get Started