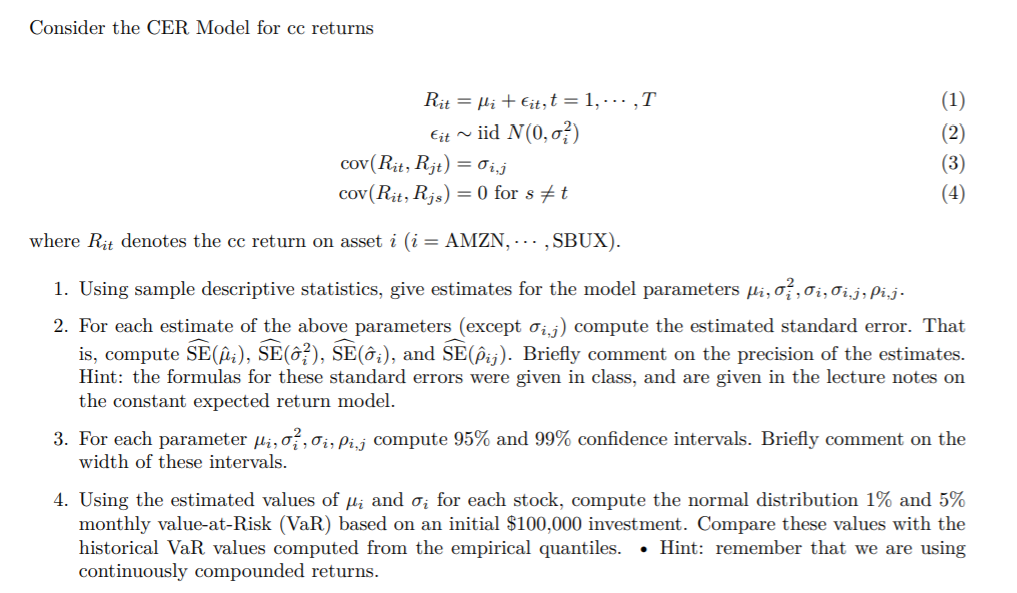
Consider the CER Model for cc returns Eit ~ Rit = Mi + it, t = 1, ... ,T - iid N(0,0%) cov(Rit, Rjt) = 0i,j cov(Rit, Rjs) = 0 for s Et (1) (2) (3) where Rit denotes the ce return on asset i (i = AMZN, ... ,SBUX). 1. Using sample descriptive statistics, give estimates for the model parameters Hi, o, 01,01.j, Pi. 2. For each estimate of the above parameters (except 0i,j) compute the estimated standard error. That is, compute SEC;), SEC), SEi), and S(@ij). Briefly comment on the precision of the estimates. Hint: the formulas for these standard errors were given in class, and are given in the lecture notes on the constant expected return model. 3. For each parameter Hi, o, Oi, Pirj compute 95% and 99% confidence intervals. Briefly comment on the width of these intervals. 4. Using the estimated values of fi and o; for each stock, compute the normal distribution 1% and 5% monthly value-at-Risk (VaR) based on an initial $100,000 investment. Compare these values with the historical VaR values computed from the empirical quantiles. Hint: remember that we are using continuously compounded returns. Consider the CER Model for cc returns Eit ~ Rit = Mi + it, t = 1, ... ,T - iid N(0,0%) cov(Rit, Rjt) = 0i,j cov(Rit, Rjs) = 0 for s Et (1) (2) (3) where Rit denotes the ce return on asset i (i = AMZN, ... ,SBUX). 1. Using sample descriptive statistics, give estimates for the model parameters Hi, o, 01,01.j, Pi. 2. For each estimate of the above parameters (except 0i,j) compute the estimated standard error. That is, compute SEC;), SEC), SEi), and S(@ij). Briefly comment on the precision of the estimates. Hint: the formulas for these standard errors were given in class, and are given in the lecture notes on the constant expected return model. 3. For each parameter Hi, o, Oi, Pirj compute 95% and 99% confidence intervals. Briefly comment on the width of these intervals. 4. Using the estimated values of fi and o; for each stock, compute the normal distribution 1% and 5% monthly value-at-Risk (VaR) based on an initial $100,000 investment. Compare these values with the historical VaR values computed from the empirical quantiles. Hint: remember that we are using continuously compounded returns


