

Question
Consider the Chipotle example we discussed in class. This time both workers M1 and M2 need a longer time to finish their tasks( The activity
Consider the Chipotle example we discussed in class. This time both workers M1 and M2 need a longer time to finish their tasks( The activity times change 90 and 60 seconds)
im not sure if these are correct
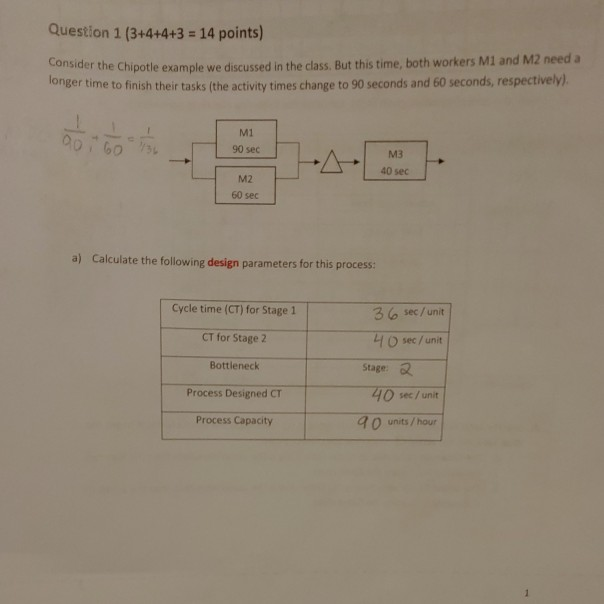
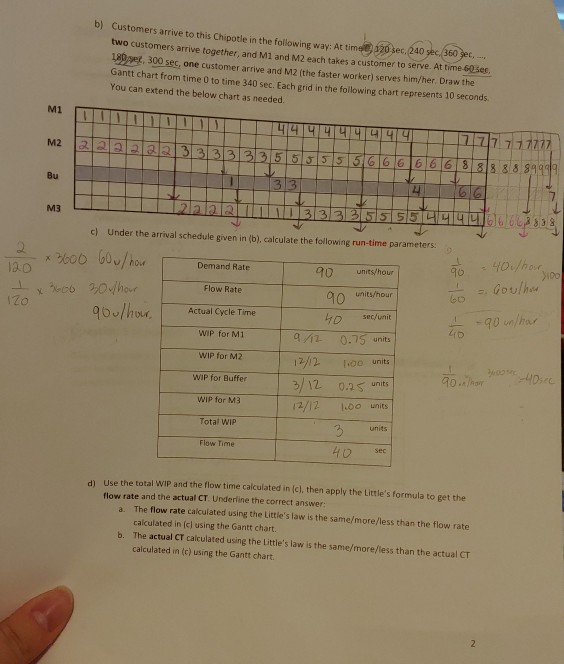
Question 1 (3+4+4+3 = 14 points) Consider the Chipotle exar the Chipotle example we discussed in the class. But this time, both workers MI and M2 need a onger time to finish their tasks (the activity times change to 90 seconds and 60 seconds, respectively) abito 0060 M1 90 sec - M3 40 sec M2 60 sec a) Calculate the following design parameters for this process: Cycle time (CT) for Stage 1 36 sec / unit CT for Stage 2 40 sec / unit Bottleneck Process Designed CT Stage 2 40 sec / unit 90 units/hour Process Capacity customers arrive to this Chipotle in the following way: At time, 120 sec.240 e 360 sec, two customers arrive together, and M1 and M2 each takes a customer to serve. At time 63ee. 10 , 300 sec, one customer arrive and M2 (the faster worker) serves him/her Draw the Gantt chart from time to time 340 sec. Each grid in the following chart represents 10 seconds You can extend the below chart as needed. TU 1949999999777777777 222222 333333555555616 616 616 888.8.8.89999 33 26 2898 c) Under the arrival schedule given in (b), calculate the following run-time parameters Demand Rate o - 40/hour - x3600 60w how 12.0 + x 300 301 hour IZO 900/hour + = Coulher 90 un/har Actual Cycle Time WIP for Mi WIP for M2 90 units/hour 90 units/hour 40 sec/unit 9/12 0.75 units 12/12 10 units 3/12 0.25 units 12/12 1.00 units 3 units 40 sec WIP for Buffer WIP for M3 Total WIP Flow Time di Use the total WIP and the flow time calculated in (c), then apply the Little's formula to get the flow rate and the actual CT. Underline the correct answer: a. The flow rate calculated using the Little's law is the same/more/less than the flow rate calculated in (c) using the Gantt chart. b. The actual CT calculated using the Little's law is the same/more/less than the actual CT calculated in (c) using the Gantt Chart Question 1 (3+4+4+3 = 14 points) Consider the Chipotle exar the Chipotle example we discussed in the class. But this time, both workers MI and M2 need a onger time to finish their tasks (the activity times change to 90 seconds and 60 seconds, respectively) abito 0060 M1 90 sec - M3 40 sec M2 60 sec a) Calculate the following design parameters for this process: Cycle time (CT) for Stage 1 36 sec / unit CT for Stage 2 40 sec / unit Bottleneck Process Designed CT Stage 2 40 sec / unit 90 units/hour Process Capacity customers arrive to this Chipotle in the following way: At time, 120 sec.240 e 360 sec, two customers arrive together, and M1 and M2 each takes a customer to serve. At time 63ee. 10 , 300 sec, one customer arrive and M2 (the faster worker) serves him/her Draw the Gantt chart from time to time 340 sec. Each grid in the following chart represents 10 seconds You can extend the below chart as needed. TU 1949999999777777777 222222 333333555555616 616 616 888.8.8.89999 33 26 2898 c) Under the arrival schedule given in (b), calculate the following run-time parameters Demand Rate o - 40/hour - x3600 60w how 12.0 + x 300 301 hour IZO 900/hour + = Coulher 90 un/har Actual Cycle Time WIP for Mi WIP for M2 90 units/hour 90 units/hour 40 sec/unit 9/12 0.75 units 12/12 10 units 3/12 0.25 units 12/12 1.00 units 3 units 40 sec WIP for Buffer WIP for M3 Total WIP Flow Time di Use the total WIP and the flow time calculated in (c), then apply the Little's formula to get the flow rate and the actual CT. Underline the correct answer: a. The flow rate calculated using the Little's law is the same/more/less than the flow rate calculated in (c) using the Gantt chart. b. The actual CT calculated using the Little's law is the same/more/less than the actual CT calculated in (c) using the Gantt Chart
Step by Step Solution
There are 3 Steps involved in it
Step: 1

Get Instant Access to Expert-Tailored Solutions
See step-by-step solutions with expert insights and AI powered tools for academic success
Step: 2

Step: 3
Ace Your Homework with AI
Get the answers you need in no time with our AI-driven, step-by-step assistance
Get Started
From Herds To Insights Harnessing Data Analytics For Sustainable Livestock Farming
Authors: Prof Suresh Neethirajan
1st Edition
B0CFD6K6KK, 979-8857075487