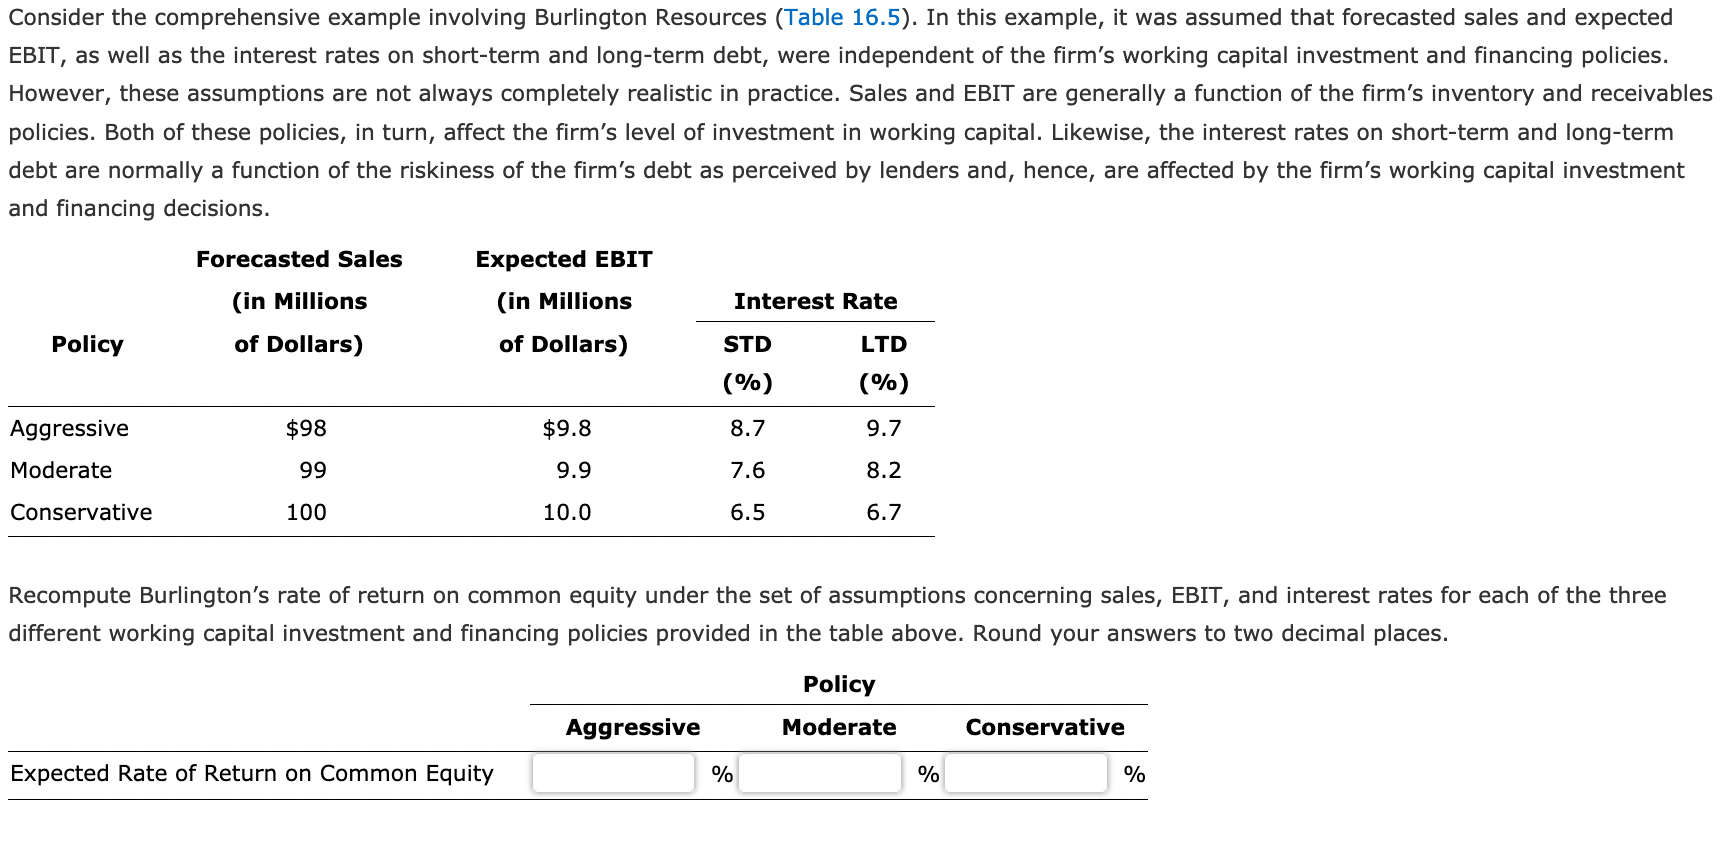
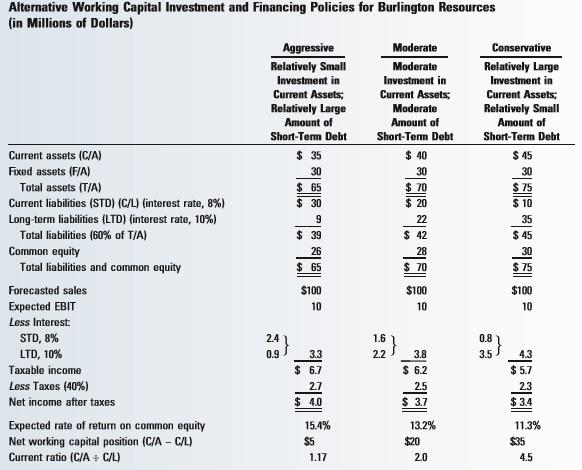
Consider the comprehensive example involving Burlington Resources (Table 16.5). In this example, it was assumed that forecasted sales and expected EBIT, as well as the interest rates on short-term and long-term debt, were independent of the firm's working capital investment and financing policies. However, these assumptions are not always completely realistic in practice. Sales and EBIT are generally a function of the firm's inventory and receivables policies. Both of these policies, in turn, affect the firm's level of investment in working capital. Likewise, the interest rates on short-term and long-term debt are normally a function of the riskiness of the firm's debt as perceived by lenders and, hence, are affected by the firm's working capital investment and financing decisions. Forecasted Sales Expected EBIT (in Millions of Dollars) (in Millions of Dollars) Interest Rate Policy STD LTD (%) (%) Aggressive $98 $9.8 8.7 9.7 Moderate 99 9.9 7.6 8.2 Conservative 100 10.0 6.5 6.7 Recompute Burlington's rate of return on common equity under the set of assumptions concerning sales, EBIT, and interest rates for each of the three different working capital investment and financing policies provided in the table above. Round your answers to two decimal places. Policy Aggressive Moderate Conservative Expected Rate of Return on Common Equity % % % 9 Alternative Working Capital Investment and Financing Policies for Burlington Resources (in Millions of Dollars) Aggressive Moderate Conservative Relatively Small Moderate Relatively Large Investment in Investment in Investment in Current Assets; Current Assets; Current Assets; Relatively Large Moderate Relatively Small Amount of Amount of Amount of Short-Term Debt Short-Term Debt Short-Term Debt Current assets (C/A) $ 35 $ 40 $ 45 Fixed assets (F/A) 30 30 30 Total assets (TIA) $ 65 $ 70 $ 75 Current liabilities (STD) (C/L) (interest rate, 8%) $ 30 $ 20 $ 10 Long-term liabilities (LTD) (interest rate, 10%) 22 35 Total liabilities (60% of T/A) $ 39 $ 42 $ 45 Common equity 26 28 30 Total liabilities and common equity $ 65 $ 70 $ 75 Forecasted sales $100 $100 $100 Expected EBIT 10 10 10 Less Interest STD, 8% 0.8 LTD, 10% 0.9 3.3 2.2 3.8 Taxable income $ 6.7 $ 6.2 $ 5.7 Less Taxes (40%) 2.5 Net income after taxes $ 4.0 $ 3.7 $ 3.4 Expected rate of return on common equity 15.4% 13.2% 11.3% Net working capital position (C/A - C/L) $5 $20 $35 Current ratio (C/ AC/L) 1.17 20 4.5 25 4.3 27 23 Consider the comprehensive example involving Burlington Resources (Table 16.5). In this example, it was assumed that forecasted sales and expected EBIT, as well as the interest rates on short-term and long-term debt, were independent of the firm's working capital investment and financing policies. However, these assumptions are not always completely realistic in practice. Sales and EBIT are generally a function of the firm's inventory and receivables policies. Both of these policies, in turn, affect the firm's level of investment in working capital. Likewise, the interest rates on short-term and long-term debt are normally a function of the riskiness of the firm's debt as perceived by lenders and, hence, are affected by the firm's working capital investment and financing decisions. Forecasted Sales Expected EBIT (in Millions of Dollars) (in Millions of Dollars) Interest Rate Policy STD LTD (%) (%) Aggressive $98 $9.8 8.7 9.7 Moderate 99 9.9 7.6 8.2 Conservative 100 10.0 6.5 6.7 Recompute Burlington's rate of return on common equity under the set of assumptions concerning sales, EBIT, and interest rates for each of the three different working capital investment and financing policies provided in the table above. Round your answers to two decimal places. Policy Aggressive Moderate Conservative Expected Rate of Return on Common Equity % % % 9 Alternative Working Capital Investment and Financing Policies for Burlington Resources (in Millions of Dollars) Aggressive Moderate Conservative Relatively Small Moderate Relatively Large Investment in Investment in Investment in Current Assets; Current Assets; Current Assets; Relatively Large Moderate Relatively Small Amount of Amount of Amount of Short-Term Debt Short-Term Debt Short-Term Debt Current assets (C/A) $ 35 $ 40 $ 45 Fixed assets (F/A) 30 30 30 Total assets (TIA) $ 65 $ 70 $ 75 Current liabilities (STD) (C/L) (interest rate, 8%) $ 30 $ 20 $ 10 Long-term liabilities (LTD) (interest rate, 10%) 22 35 Total liabilities (60% of T/A) $ 39 $ 42 $ 45 Common equity 26 28 30 Total liabilities and common equity $ 65 $ 70 $ 75 Forecasted sales $100 $100 $100 Expected EBIT 10 10 10 Less Interest STD, 8% 0.8 LTD, 10% 0.9 3.3 2.2 3.8 Taxable income $ 6.7 $ 6.2 $ 5.7 Less Taxes (40%) 2.5 Net income after taxes $ 4.0 $ 3.7 $ 3.4 Expected rate of return on common equity 15.4% 13.2% 11.3% Net working capital position (C/A - C/L) $5 $20 $35 Current ratio (C/ AC/L) 1.17 20 4.5 25 4.3 27 23


