Question
Consider the corn market. The demand for corn is given by P = 60-0.3Q and supply of corn is given by P = 10

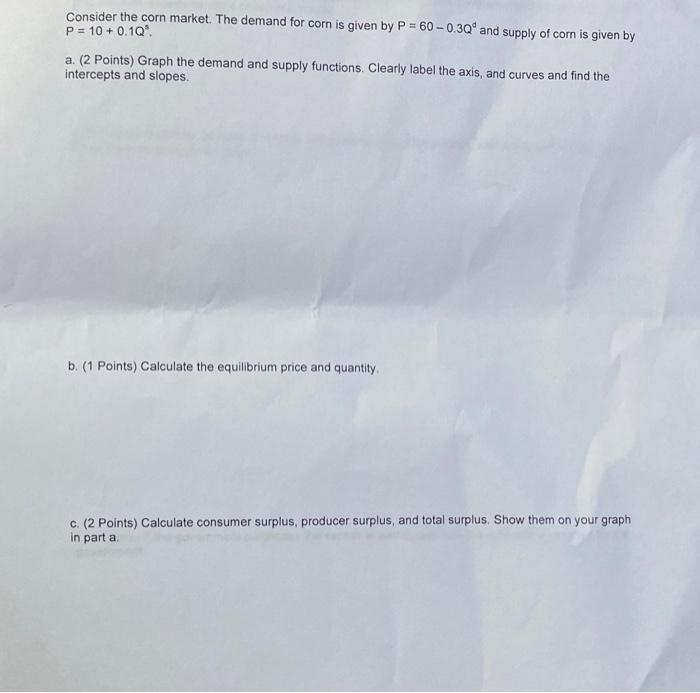
Consider the corn market. The demand for corn is given by P = 60-0.3Q and supply of corn is given by P = 10 + 0.1Q. a. (2 Points) Graph the demand and supply functions. Clearly label the axis, and curves and find the intercepts and slopes. b. (1 Points) Calculate the equilibrium price and quantity. c. (2 Points) Calculate consumer surplus, producer surplus, and total surplus. Show them on your graph in part a.
Step by Step Solution
3.48 Rating (155 Votes )
There are 3 Steps involved in it
Step: 1

Get Instant Access to Expert-Tailored Solutions
See step-by-step solutions with expert insights and AI powered tools for academic success
Step: 2

Step: 3

Ace Your Homework with AI
Get the answers you need in no time with our AI-driven, step-by-step assistance
Get StartedRecommended Textbook for
Microeconomics
Authors: Austan Goolsbee, Steven Levitt, Chad Syverson
1st Edition
978-1464146978, 1464146977
Students also viewed these Economics questions
Question
Answered: 1 week ago
Question
Answered: 1 week ago
Question
Answered: 1 week ago
Question
Answered: 1 week ago
Question
Answered: 1 week ago
Question
Answered: 1 week ago
Question
Answered: 1 week ago
Question
Answered: 1 week ago
Question
Answered: 1 week ago
Question
Answered: 1 week ago
Question
Answered: 1 week ago
Question
Answered: 1 week ago
Question
Answered: 1 week ago
Question
Answered: 1 week ago
Question
Answered: 1 week ago
Question
Answered: 1 week ago
Question
Answered: 1 week ago
Question
Answered: 1 week ago
Question
Answered: 1 week ago
Question
Answered: 1 week ago
Question
Answered: 1 week ago
Question
Answered: 1 week ago
View Answer in SolutionInn App


