Question
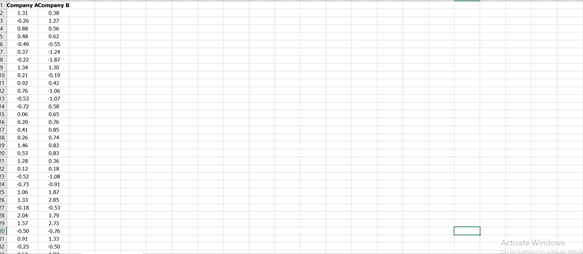
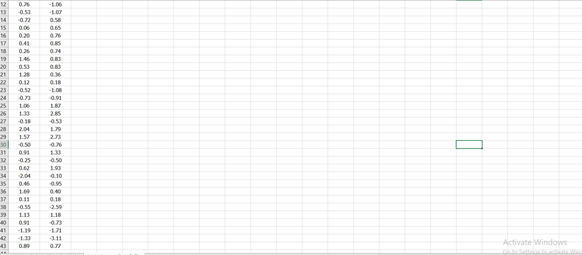
Consider the daily percent change in the stock price of two companies, A and B, in an investment portfolio. The dataset is called Investment Portfolio.
Consider the daily percent change in the stock price of two companies, A and B, in an
investment portfolio. The dataset is called Investment Portfolio.
Answer the following questions manually. Use statistical software or MS Excel for help with
the computation of any summary statistics needed for manual computations.
a) Draw a scatterplot of the company A daily percent changes against the company B daily
percent changes. Describe the relationship between daily percent changes that you see
in this scatterplot.
b) Determine the regression equation to predict the daily percent change in the stock price
of company A from the daily percent change in the stock price of company B. Interpret
the value of the slope coefficient.
c) Find the correlation between the percent changes. Does the correlation value support
your description of the scatterplot in part a)?
d) Compute the corresponding coefficient of determination and interpret its value. In
financial terms, it represents the proportion of non-diversifiable risk in company A.
e) Compute the 95% confidence interval for the slope coefficient.
f) Test at the 5% significance level whether the slope coefficient is significantly different
from 1, representing the beta of a highly diversified portfolio. Don't forget to show your
computations.


Step by Step Solution
There are 3 Steps involved in it
Step: 1

Get Instant Access to Expert-Tailored Solutions
See step-by-step solutions with expert insights and AI powered tools for academic success
Step: 2

Step: 3

Ace Your Homework with AI
Get the answers you need in no time with our AI-driven, step-by-step assistance
Get Started


