

Question
Consider the data in Table 12.1. Construct a bounded adjustment chart using lambda=0.4 and L=10. Compare the performance of this chart to the one in
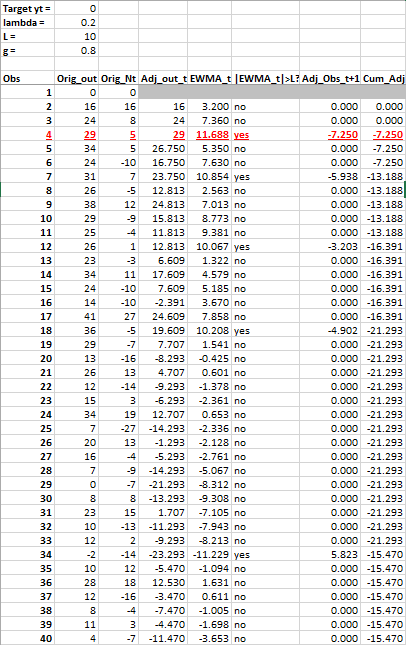
Consider the data in Table 12.1. Construct a bounded adjustment chart using lambda=0.4 and L=10. Compare the performance of this chart to the one in Table 12.1 and Figure 12.12. Use Excel as I showed you in the lecture.
End of Table 12.1 and Figure 12.12
Table 12.1
Step by Step Solution
There are 3 Steps involved in it
Step: 1

Get Instant Access to Expert-Tailored Solutions
See step-by-step solutions with expert insights and AI powered tools for academic success
Step: 2

Step: 3
Ace Your Homework with AI
Get the answers you need in no time with our AI-driven, step-by-step assistance
Get Started
Calculus Early Transcendentals
Authors: James Stewart
8th edition
1285741552, 9781305482463 , 978-1285741550