Consider the financial data from Exhibits 5, 6, & 10 in the case. Use only numbers from the case and these questions. There is no need to research any additional data.
- Using a YOY analysis, describe Starbucks a. revenue performance a. From 2017 to 2018.
-
- From 2017 to 2018 for China/Asia Pacific only.
- How would you compare Starbucks total YOY revenue to China/Asia Pacific YOY? What insight can we gain by looking at these numbers and other data in the exhibits?
2. Using operating income in the exhibits, calculate the Net Profit Margins for Starbucks for 2017 and 2018 for
a.Starbucks worldwide.
b.Starbucks in China/Asia Pacific.
c.How do net profits in China compare to the worldwide numbers? Why?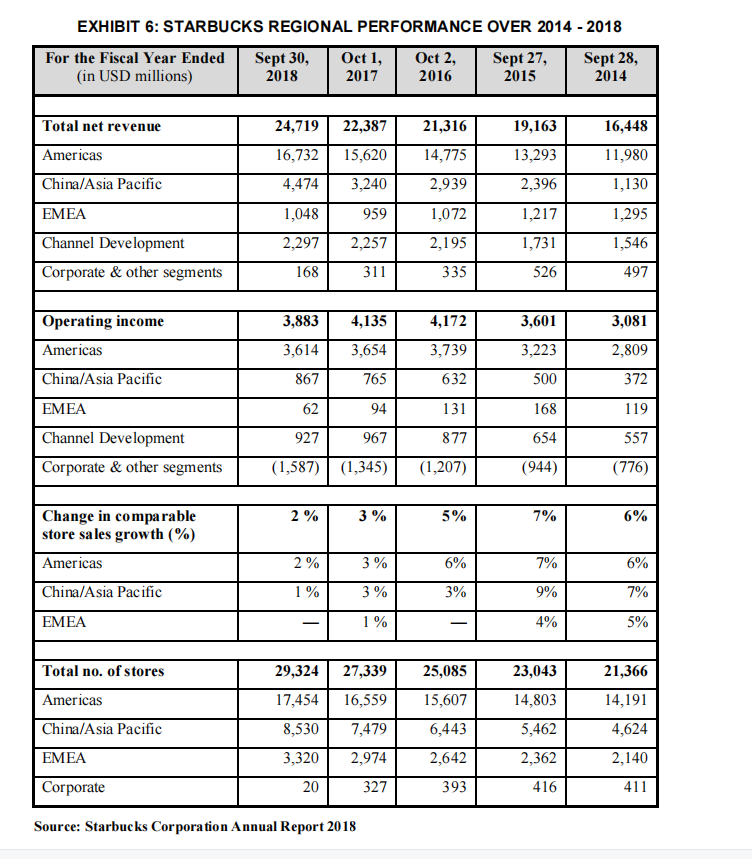
- According to Mintel, the coffee shop market was estimated to be worth $10.4 Billion USD in China.
- Using this estimate, what was Starbucks revenue market share for China in 2018 (user China/Asia Pacific numbers)?
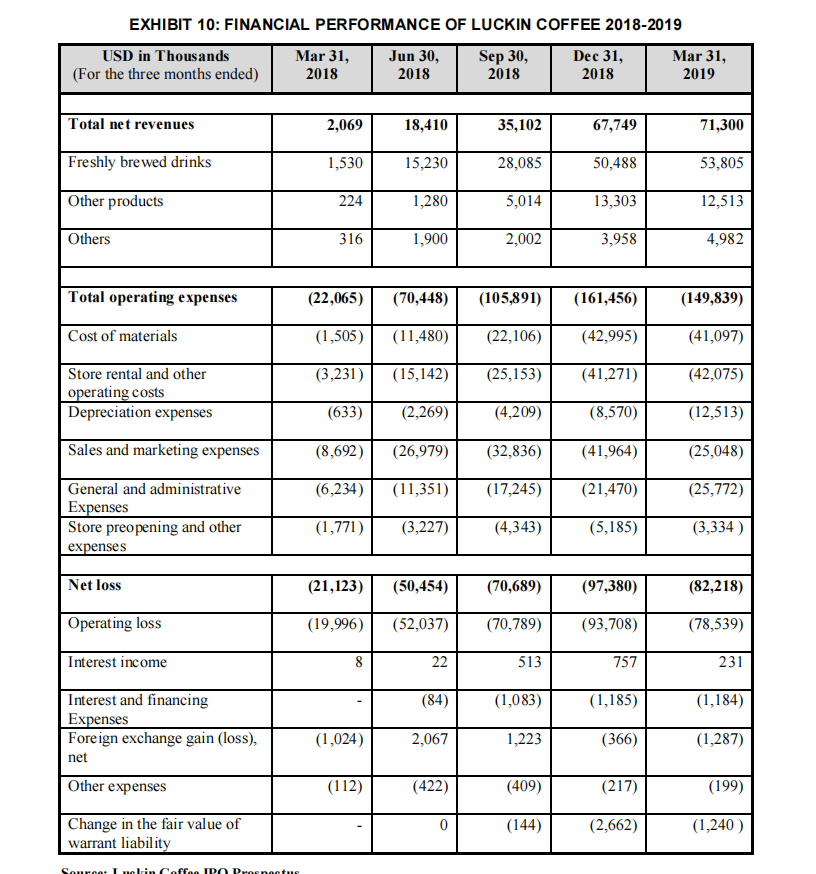
- What was Luckins revenue market share for China in 2018? (note that revenue Ex. 10 is expressed in thousands)
- Looking at other data in the case, should Starbucks be worried about Luckin? Why?

EXHIBIT 10: FINANCIAL PERFORMANCE OF LUCKIN COFFEE 2018-2019 USD in Thousands Mar 31, Jun 30, Sep 30, Dec 31, Mar 31, (For the three months ended) 2018 2018 2018 2018 2019 Total net revenues 2,069 18,410 35,102 67,749 71,300 Freshly brewed drinks 1,530 15,230 28,085 50,488 53,805 Other products 224 1,280 5,014 13,303 12,513 Others 316 1,900 2,002 3,958 4,982 Total operating expenses (22,065) (70,448) (105,891) (161,456) (149,839) Cost of materials (1,505) (11,480) (22,106) (42,995) (41,097) (3,231) (15,142) (25,153) (41,271) (42,075) Store rental and other operating costs Depreciation expenses (633) (2,269) (4,209) (8,570) (12,513) Sales and marketing expenses (8,692) (26,979) (32,836) (41,964) (25,048) 6,234) (11,351) (17,245) (21,470) (25,772) General and administrative Expenses Store preopening and other expenses (1,771) (3,227) (4,343) (5,185) (3,334) Net loss (21,123) (50,454) (70,689) (97,380) (82,218) Operating loss (19,996) (52,037) (70,789) (93,708) (78,539) Interest income 8 22 513 757 231 (84) (1,083) (1,185) (1,184) Interest and financing Expenses Foreign exchange gain (loss), (1,024) 2,067 1,223 (366) (1,287) net Other expenses (112) (422) (409) (217) (199) 0 Change in the fair value of warrant liability (144) (2,662) (1,240 ) EXHIBIT 6: STARBUCKS REGIONAL PERFORMANCE OVER 2014 - 2018 For the Fiscal Year Ended Sept 30, Oct 1, Oct 2, Sept 27, Sept 28, (in USD millions) 2018 2017 2016 2015 2014 Total net revenue 24,719 22,387 21,316 19,163 16,448 15,620 14,775 13,293 11,980 16,732 4,474 3,240 2,939 2,396 1,130 Americas China/Asia Pacific EMEA Channel Development Corporate & other segments 1,048 959 1,072 1,217 1,295 2,297 2,257 2,195 1,731 1,546 168 311 335 526 497 3,883 4,135 4,172 3,601 3,081 Operating income Americas 3,614 3,654 3,739 3,223 2,809 372 China/Asia Pacific 867 765 632 500 62 94 131 168 119 EMEA Channel Development Corporate & other segments 927 967 877 654 557 (1,587) (1,345) (1,207) (944) (776) 2% 3 % 5% 7% 6% Change in comparable store sales growth (%) Americas 2% 3% 6% 7% 6% China/Asia Pacific 1 % 3 % 3% 9% 7% EMEA 1 % 4% 5% Total no. of stores 29,324 25,085 23,043 21,366 27,339 16,559 Americas 17,454 15,607 14,803 14,191 8,530 7,479 6,443 5,462 China/Asia Pacific EMEA Corporate 4,624 2,140 3,320 2,974 2,362 2,642 393 20 327 416 411 Source: Starbucks Corporation Annual Report 2018 EXHIBIT 10: FINANCIAL PERFORMANCE OF LUCKIN COFFEE 2018-2019 USD in Thousands Mar 31, Jun 30, Sep 30, Dec 31, Mar 31, (For the three months ended) 2018 2018 2018 2018 2019 Total net revenues 2,069 18,410 35,102 67,749 71,300 Freshly brewed drinks 1,530 15,230 28,085 50,488 53,805 Other products 224 1,280 5,014 13,303 12,513 Others 316 1,900 2,002 3,958 4,982 Total operating expenses (22,065) (70,448) (105,891) (161,456) (149,839) Cost of materials (1,505) (11,480) (22,106) (42,995) (41,097) (3,231) (15,142) (25,153) (41,271) (42,075) Store rental and other operating costs Depreciation expenses (633) (2,269) (4,209) (8,570) (12,513) Sales and marketing expenses (8,692) (26,979) (32,836) (41,964) (25,048) 6,234) (11,351) (17,245) (21,470) (25,772) General and administrative Expenses Store preopening and other expenses (1,771) (3,227) (4,343) (5,185) (3,334) Net loss (21,123) (50,454) (70,689) (97,380) (82,218) Operating loss (19,996) (52,037) (70,789) (93,708) (78,539) Interest income 8 22 513 757 231 (84) (1,083) (1,185) (1,184) Interest and financing Expenses Foreign exchange gain (loss), (1,024) 2,067 1,223 (366) (1,287) net Other expenses (112) (422) (409) (217) (199) 0 Change in the fair value of warrant liability (144) (2,662) (1,240 )