

Answered step by step
Verified Expert Solution
Question
1 Approved Answer
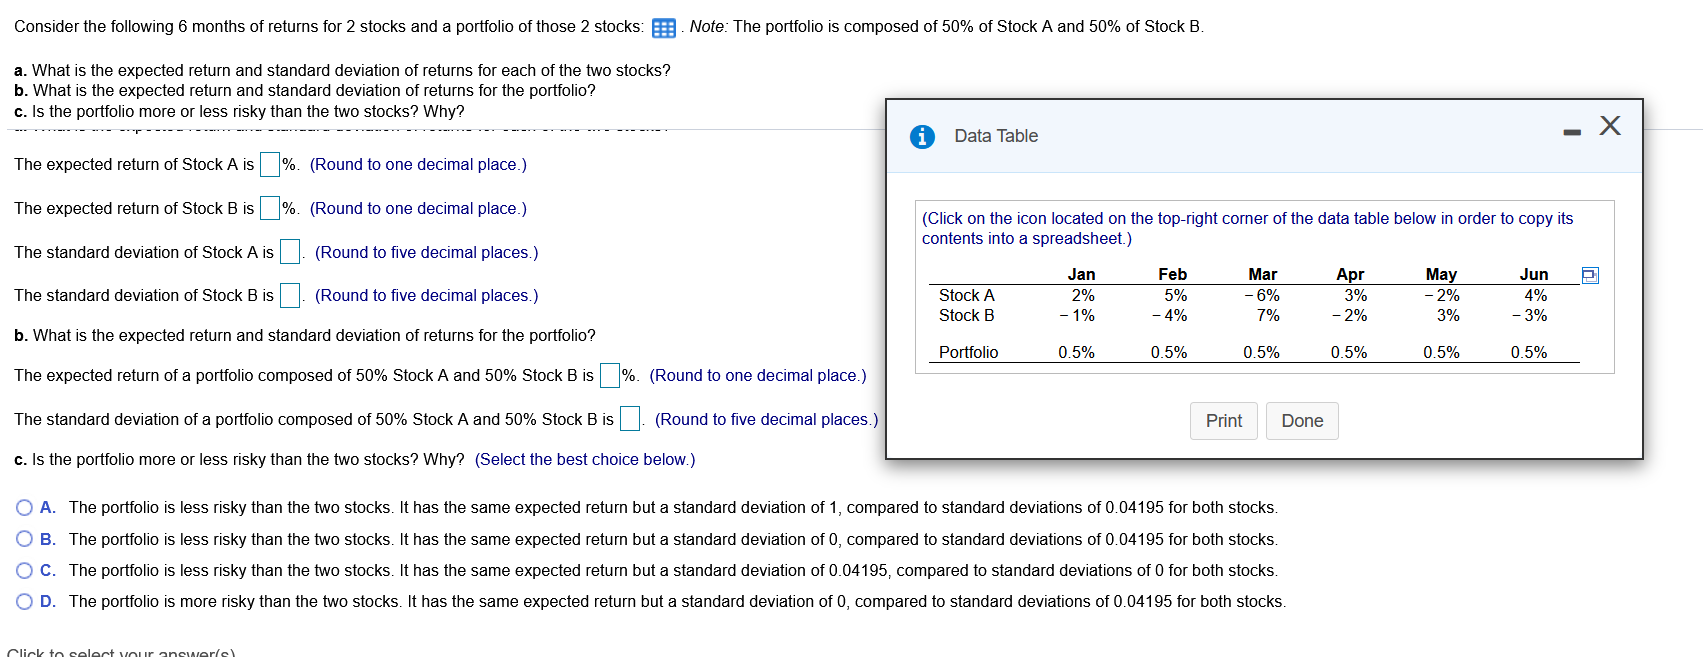
Consider the following 6 months of returns for 2 stocks and a portfolio of those 2 stocks: Note: The portfolio is composed of 50% of
Step by Step Solution
There are 3 Steps involved in it
Step: 1

Get Instant Access to Expert-Tailored Solutions
See step-by-step solutions with expert insights and AI powered tools for academic success
Step: 2

Step: 3
Ace Your Homework with AI
Get the answers you need in no time with our AI-driven, step-by-step assistance
Get Started
Conspiracy Theories And Unpopular Culture
Authors: Isaac Weishaupt
1st Edition
979-8633825282