Consider the following capital restructure plan: use $209 million of cash from its balance sheet and $50 million in new debt-bearing interest at the rate of 6.75% to repurchase 14 million shares at a price of $18.50 per share.
Whats the firm value before and after stock repurchase?
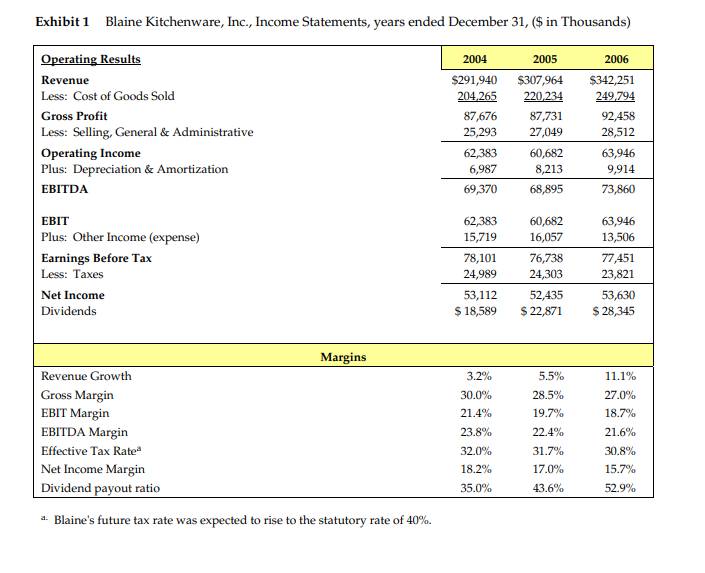
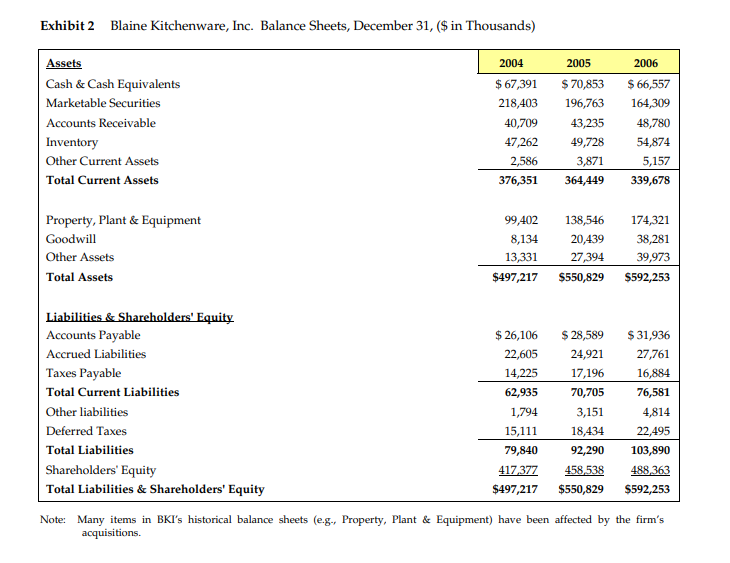
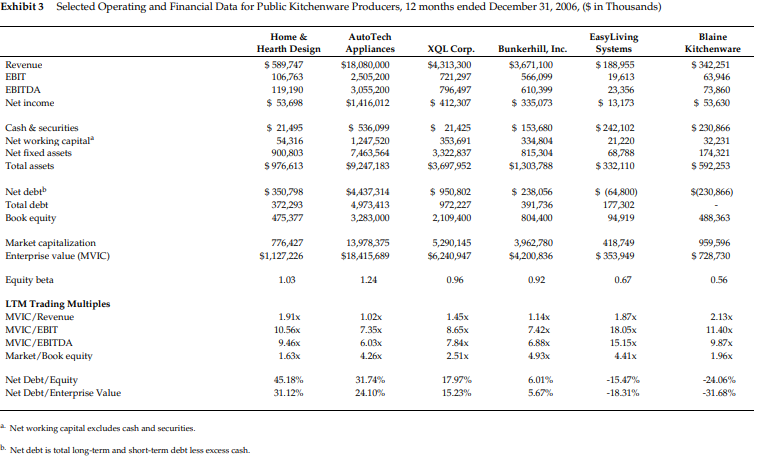
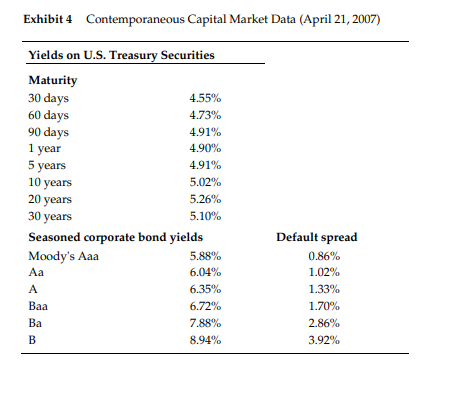
Exhibit 1 Blaine Kitchenware, Inc., Income Statements, years ended December 31, ($ in Thousands) Operating Results Revenue Less: Cost of Goods Sold Gross Profit Less: Selling, General & Administrative Operating Income Plus: Depreciation & Amortization EBITDA 2004 $291,940 204,265 87,676 25,293 62,383 6,987 69,370 2005 $307,964 220,234 87,731 27,049 60,682 8,213 68,895 2006 $342,251 249,794 92,458 28,512 63,946 9,914 73,860 EBIT Plus: Other Income (expense) Earnings Before Tax Less: Taxes Net Income Dividends 62,383 15,719 78,101 24,989 60,682 16,057 76,738 24,303 52,435 $ 22,871 63,946 13,506 77,451 23,821 53,630 $ 28,345 53,112 $ 18,589 Margins 3.2% 5.5% 11.1% 28.5% 19.7% 27.0% 18.7% Revenue Growth Gross Margin EBIT Margin EBITDA Margin Effective Tax Rate Net Income Margin Dividend payout ratio 30.0% 21.4% 23.8% 32.0% 18.2% 22.4% 31.7% 17.0% 43.6% 21.6% 30.8% 15.7% 52.9% 35.0% a. Blaine's future tax rate was expected to rise to the statutory rate of 40%. Exhibit 2 Blaine Kitchenware, Inc. Balance Sheets, December 31, ($ in Thousands) 2005 2006 Assets Cash & Cash Equivalents Marketable Securities Accounts Receivable Inventory Other Current Assets Total Current Assets 2004 $ 67,391 218,403 40,709 47,262 2,586 376,351 $ 70,853 196,763 43,235 49,728 3,871 364,449 $ 66,557 164,309 48,780 54,874 5,157 339,678 Property, Plant & Equipment Goodwill Other Assets Total Assets 99,402 138,546 8,134 20,439 13,331 27,394 $497,217 $550,829 174,321 38,281 39,973 $592,253 Liabilities & Shareholders' Equity Accounts Payable Accrued Liabilities Taxes Payable Total Current Liabilities Other liabilities Deferred Taxes Total Liabilities Shareholders' Equity Total Liabilities & Shareholders' Equity $ 26,106 22,605 14,225 62,935 1,794 15,111 79,840 417,377 $497,217 $ 28,589 24,921 17,196 70,705 3,151 18,434 92,290 458,538 $550,829 $ 31,936 27,761 16,884 76,581 4,814 22,495 103,890 488,363 $592,253 Note: Many items in BKI's historical balance sheets (e.g., Property, Plant & Equipment) have been affected by the firm's acquisitions. Exhibit3 Selected Operating and Financial Data for Public Kitchenware Producers, 12 months ended December 31, 2006, ($ in Thousands) Revenue EBIT EBITDA Net income Home & Hearth Design $589,747 106,763 119,190 $ 53,698 Auto Tech Appliances $18,080,000 2,505,200 3,055,200 $1,416,012 XQL Corp $4,313,300 721,297 796,497 $ 412,307 Bunkerhill, Inc. $3,671,100 566,099 610,399 $ 335,073 Easy Living Systems $ 188,955 19,613 23,356 $ 13,173 Blaine Kitchenware $ 342,251 63,946 73,860 $ 53,630 Cash & securities Net working capital Net fixed assets Total assets $ 21,495 54,316 900,803 $ 976,613 $ 536,099 1,247,520 7,463,561 $9,247,183 $ 21,425 353,691 3,322,837 $3,697,952 $ 153,680 334,804 815,304 $1,303,788 $ 242,102 21,220 68,788 $ 332,110 $ 230,866 32,231 174,321 $ 592,253 $(230,866) $ 350,798 372,293 475,377 $4,437 314 4,973,413 3,283,000 $ 950,802 972,227 2,109,400 $ 238,056 391,736 804,400 $ (64,800) 177,302 94,919 488,363 776,427 $1,127,226 13,978,375 $18,415,689 5,290,145 $6,240,947 3,962,780 $4,200,836 418,749 $ 353,949 959,596 $ 728,730 1.03 1.24 0.96 0.92 0.67 0.56 Net deb Total debt Book equity Market capitalization Enterprise value (MVIC) Equity beta LTM Trading Multiples MVIC/Revenue MVIC/EBIT MVIC/EBITDA Market/Book equity Net Debt/Equity Net Debt/Enterprise Value 1.91% 10.56x 9.46x 1.63% 1.02x 7.35% 6.03x 4.26% 1.45x 8.65x 7.84x 2.51x 1.14x 7.42% 6.88x 4.93x 1.87% 18.05X 15.15x 4.41x 2.13x 11.40x 9.87% 1.96 45.18% 31.12% 31.74% 24.10% 17.97% 15.23% 6.01% 5.67% -15.47% -18.31% -24.06% -31.68% Net working capital excludes cash and securities. b. Net debt is total long-term and short-term debt less excess cash. Exhibit 4 Contemporaneous Capital Market Data (April 21, 2007) 1 year Yields on U.S. Treasury Securities Maturity 30 days 4.55% 60 days 4.73% 90 days 4.91% 4.90% 5 years 4.91% 10 years 5.02% 20 years 5.26% 30 years 5.10% Seasoned corporate bond yields Moody's Aaa 5.88% 6.04% A 6.35% Baa 6.72% Ba 7.88% B 8.94% Default spread 0.86% 1.02% 1.33% 1.70% 2.86% 3.92%


