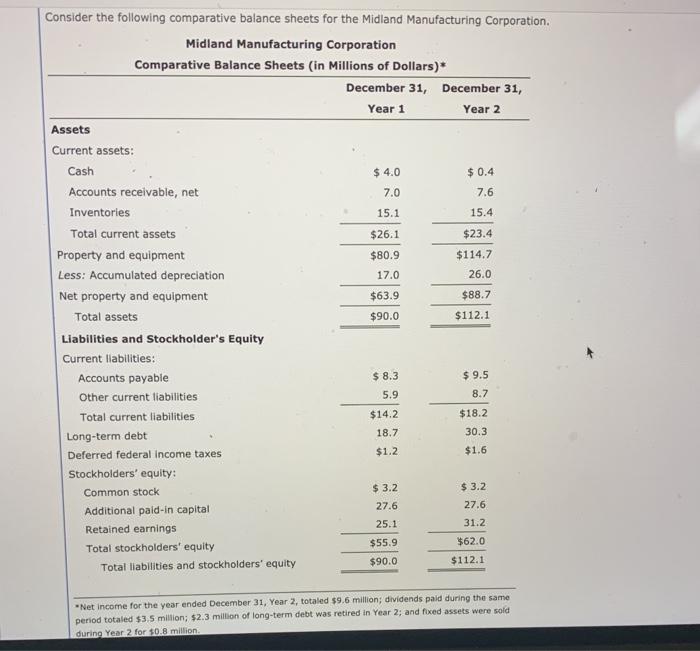
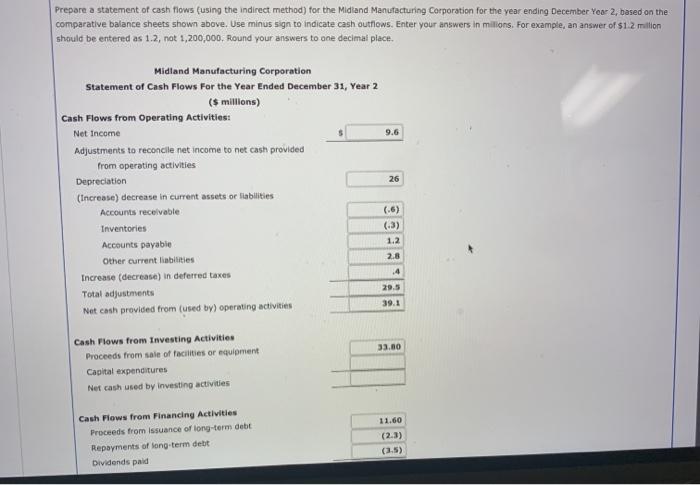
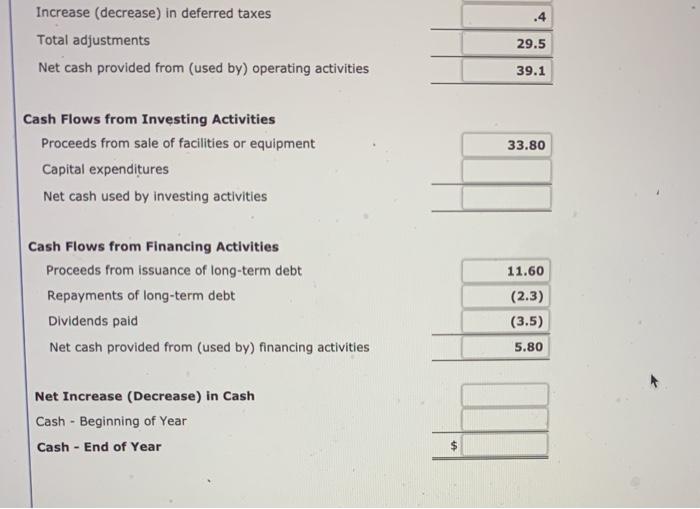
Consider the following comparative balance sheets for the Midland Manufacturing Corporation. Midland Manufacturing Corporation Comparative Balance Sheets (in Millions of dollars)* December 31, December 31, Year 1 Year 2 Assets Current assets: Cash $ 4.0 $ 0.4 Accounts receivable, net 7.0 7.6 Inventories 15.1 15.4 Total current assets $26.1 $23.4 Property and equipment $80.9 $114.7 Less: Accumulated depreciation 17.0 26.0 Net property and equipment $63.9 $88.7 Total assets $90.0 Liabilities and Stockholder's Equity Current liabilities: Accounts payable $ 8.3 $ 9.5 Other current liabilities 8.7 Total current liabilities $14.2 $18.2 Long-term debt 30.3 Deferred federal income taxes $1.2 Stockholders' equity: Common stock $ 3.2 $ 3.2 Additional pald-in capital 27.6 27.6 Retained earnings Total stockholders' equity $55.9 $62.0 Total liabilities and stockholders' equity $90.0 $112.1 $112.1 5.9 18.7 $1.6 25.1 31.2 -Net Income for the year ended December 31, Year 2, totaled $9.6 million; dividends paid during the same period totaled $3.5 million; $2.3 million of long-term debt was retired in Year 2; and fixed assets were sold during Year 2 for $0.8 million Prepare a statement of cash flows (using the indirect method) for the Midland Manufacturing Corporation for the year ending December Your 2, based on the comparative balance sheets shown above. Use minus sign to indicate cash outflows. Enter your answers in milions. For example, an answer of $1.2 million should be entered as 1.2, not 1,200,000. Round your answers to one decimal place. Midland Manufacturing Corporation Statement of Cash Flows For the Year Ended December 31, Year 2 ($ millions) Cash Flows from Operating Activities: Net Income Adjustments to reconcile net income to net cash provided from operating activities Depreciation 26 (Increase) decrease in current assets or liabilities Accounts receivable (6) Inventories (-3) Accounts payable 1.2 Other current liabilities 2.8 Increase (decrease) in deferred taxes Total adjustments 29.5 39.1 Net cash provided from (used by) operating activities 24 33.00 Cash Flows from Investing Activities Proceeds from sale of facilities or equipment Capital expenditures Net cash used by investing activities 11.60 Cash Flows from Financing Activities Proceeds from Issuance of long-term debt Repayments of long term debt Dividends paid (2.3) (3.5) Increase (decrease) in deferred taxes Total adjustments Net cash provided from (used by) operating activities 29.5 39.1 33.80 Cash Flows from Investing Activities Proceeds from sale of facilities or equipment Capital expenditures Net cash used by investing activities Cash Flows from Financing Activities Proceeds from issuance of long-term debt Repayments of long-term debt Dividends paid Net cash provided from (used by) financing activities 11.60 (2.3) (3.5) 5.80 Net Increase (Decrease) in Cash Cash - Beginning of Year Cash - End of Year $