

Answered step by step
Verified Expert Solution
Question
1 Approved Answer
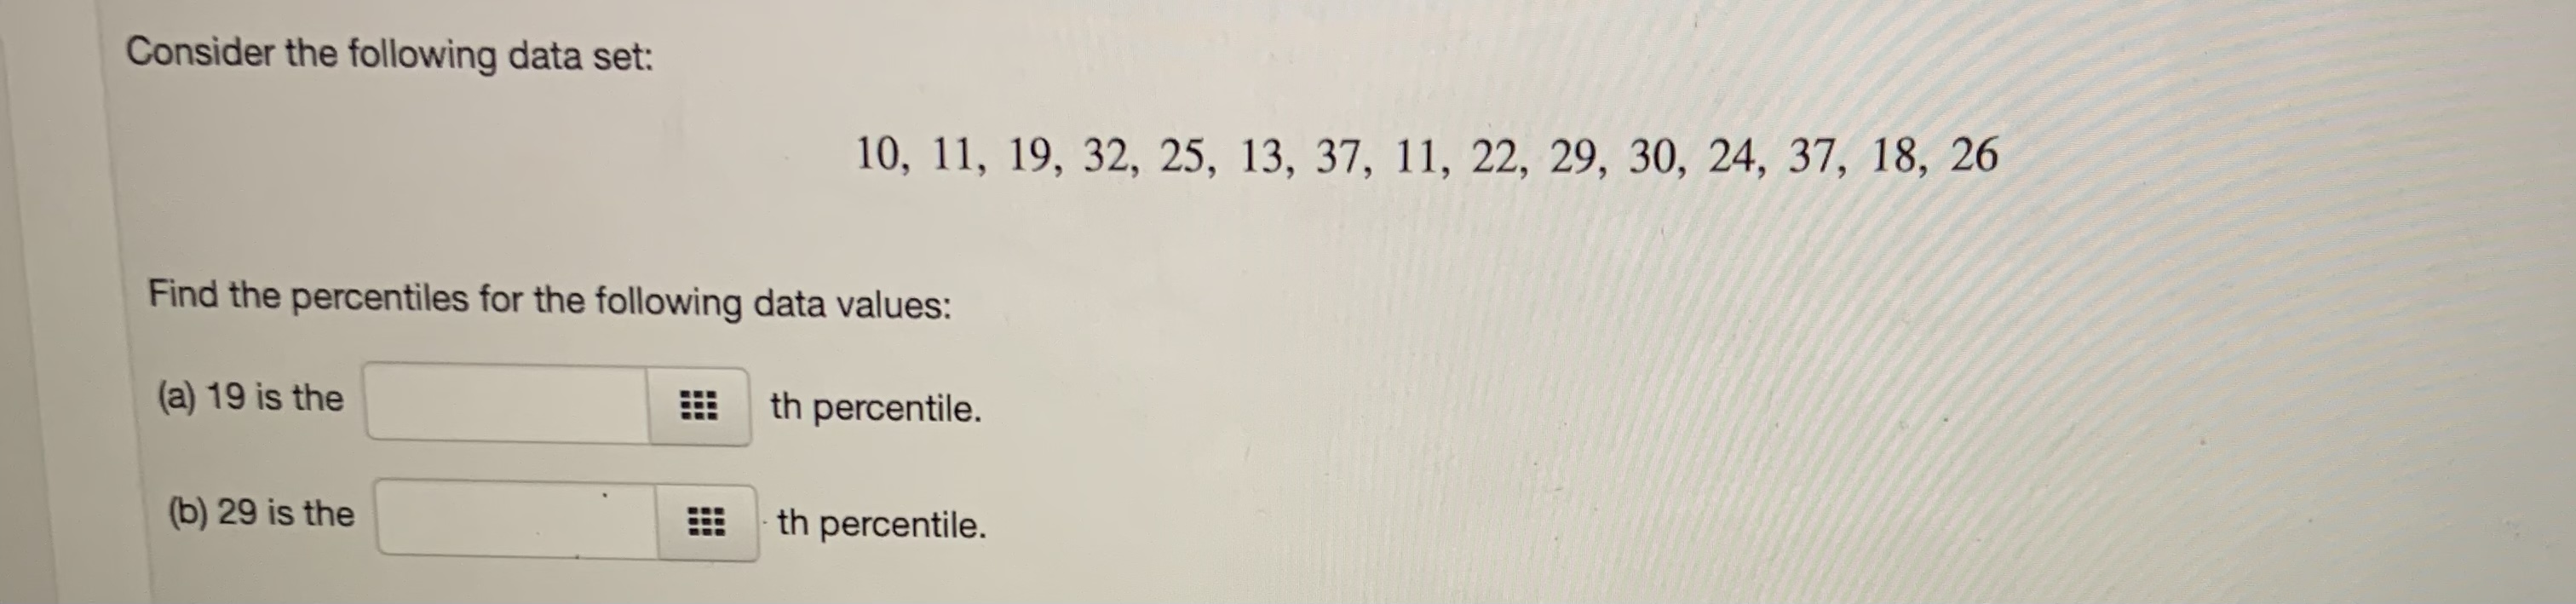
Consider the following data set: 10, 11, 19, 32, 25, 13, 37, 11, 22, 29, 30, 24, 37, 18, 26 Find the percentiles for the
Step by Step Solution
There are 3 Steps involved in it
Step: 1

Get Instant Access to Expert-Tailored Solutions
See step-by-step solutions with expert insights and AI powered tools for academic success
Step: 2

Step: 3
Ace Your Homework with AI
Get the answers you need in no time with our AI-driven, step-by-step assistance
Get Started
Mathematics Concepts With Applications
Authors: Charles P McKeague
1st Edition
1630983136, 9781630983130