

Question
Consider the following data set:CLASS Frequency10 up to 2020 up to 3030 up to 4040 up to 50a. Construct the relative frequency distribution. (Round your
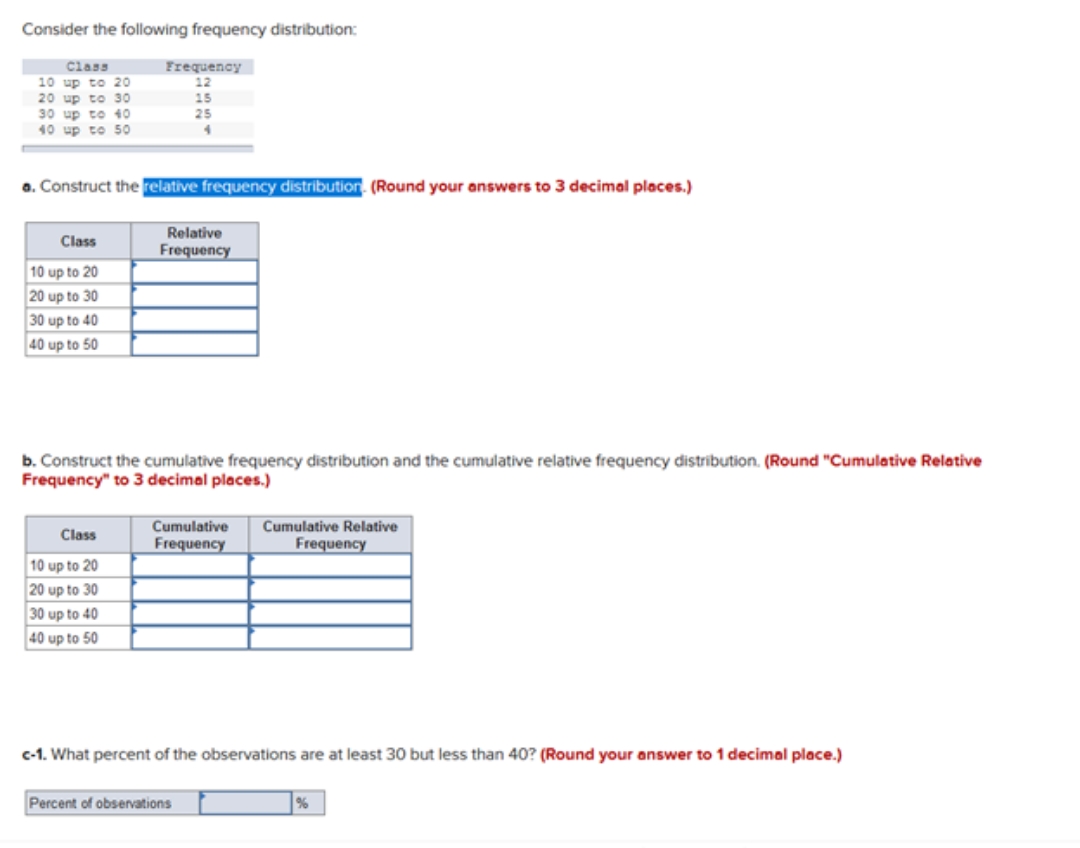
Consider the following data set:CLASS Frequency10 up to 2020 up to 3030 up to 4040 up to 50a. Construct the relative frequency distribution. (Round your answers to 3 decimal places.)b. Construct the cumulative frequency distribution and the cumulative relative frequency distribution. (Round "Cumulative Relative Frequency" to 3 decimal places.)CLASS Cumulative Frequency Cumulative Relative Frequency 10 up to 2020 up to 3030 up to 4040 up to 50c-1. What percent of the observations are at least 30 but less than 40? (Round your answer to 1 decimal place.)c-2. What percent of the observations are less than 40? (Round your answer to 1 decimal place.)
Step by Step Solution
There are 3 Steps involved in it
Step: 1

Get Instant Access to Expert-Tailored Solutions
See step-by-step solutions with expert insights and AI powered tools for academic success
Step: 2

Step: 3
Ace Your Homework with AI
Get the answers you need in no time with our AI-driven, step-by-step assistance
Get Started
Intermediate Algebra With Trigonometry
Authors: Charles P McKeague
1st Edition
1483218759, 9781483218755