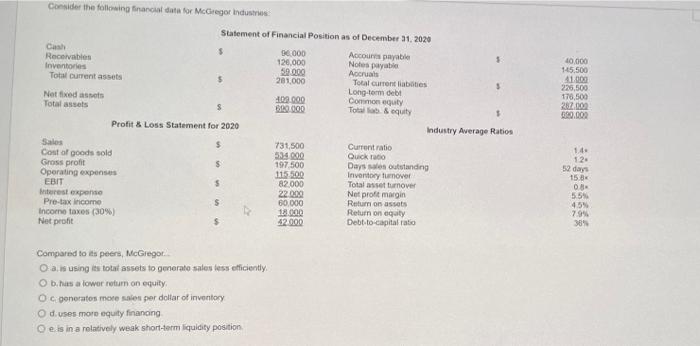
Consider the following financial data for McGregor industries 10.000 145,500 41.000 225.500 176,500 202.002 690.000 Statement of Financial Position as of December 31, 2020 Cash $ 90.000 Receivables Accounts payable 126.000 Noles payable Inventories 59.000 Accruas Total current assets 201000 Total current liabities 5 Long-term debt Not fixed 400.000 Common equity Total assets Total & equity Profit & Loss Statement for 2020 Industry Average Ratios Sales $ 731,500 Current ratio Cost of goods sold 934000 Quick to Gross profit $ 197.500 Days outstanding Operating expenses 115.500 Inventory turnover EBIT $ 82.000 Total asset tumover Interest expense 22000 Net profit margin Pre-tax income $ 60.000 Return on assets Income taxes (30%) 18.000 Return on eaty Net profit $ 42.000 Debt-to-capital ratio 1.4 12 52 days 15.8 03 55% 4.5% 795 389 Compared to its peers, McGregor O.a. is using its totat assets to gmerato salen dess efficiently, Ob has a lower return on equity Oc generates more sales per dollar of inventory Od uses more equity financing e is in a relatively weak short-term liquidity position Consider the following financial data for McGregor industries 10.000 145,500 41.000 225.500 176,500 202.002 690.000 Statement of Financial Position as of December 31, 2020 Cash $ 90.000 Receivables Accounts payable 126.000 Noles payable Inventories 59.000 Accruas Total current assets 201000 Total current liabities 5 Long-term debt Not fixed 400.000 Common equity Total assets Total & equity Profit & Loss Statement for 2020 Industry Average Ratios Sales $ 731,500 Current ratio Cost of goods sold 934000 Quick to Gross profit $ 197.500 Days outstanding Operating expenses 115.500 Inventory turnover EBIT $ 82.000 Total asset tumover Interest expense 22000 Net profit margin Pre-tax income $ 60.000 Return on assets Income taxes (30%) 18.000 Return on eaty Net profit $ 42.000 Debt-to-capital ratio 1.4 12 52 days 15.8 03 55% 4.5% 795 389 Compared to its peers, McGregor O.a. is using its totat assets to gmerato salen dess efficiently, Ob has a lower return on equity Oc generates more sales per dollar of inventory Od uses more equity financing e is in a relatively weak short-term liquidity position


