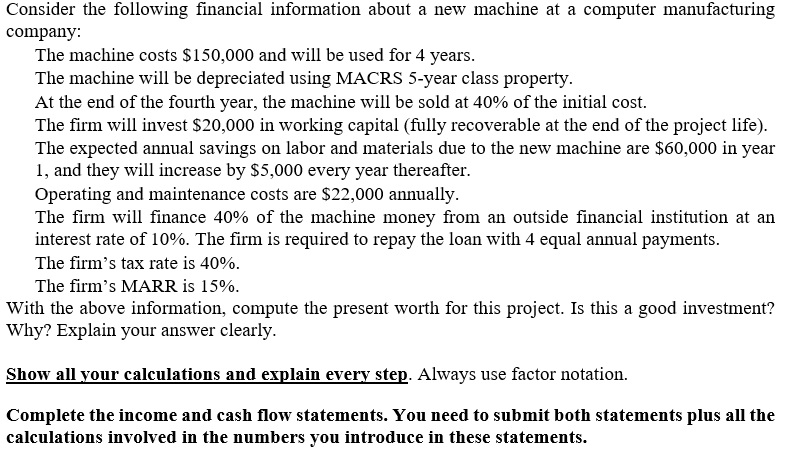
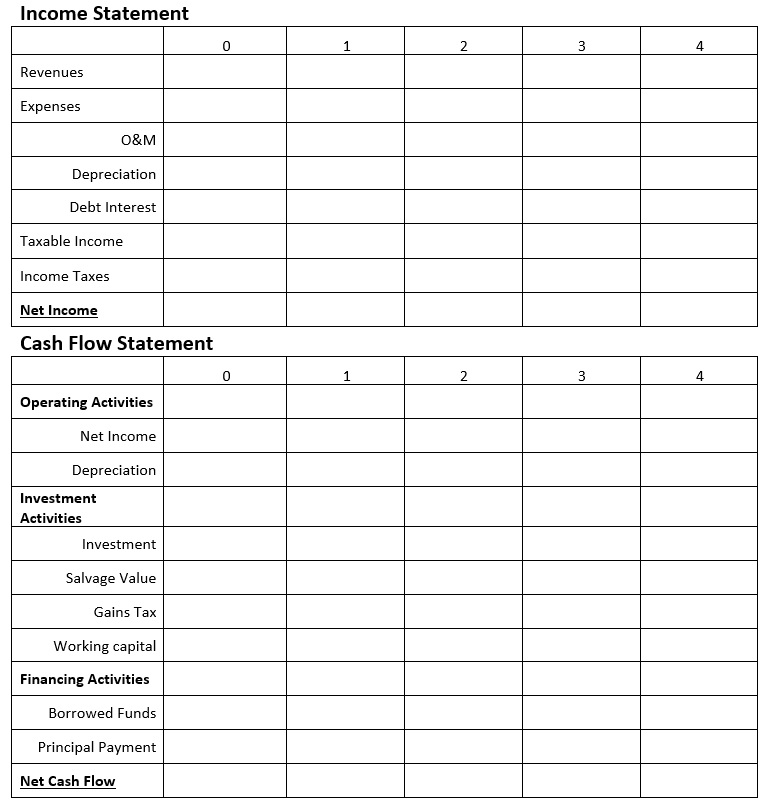
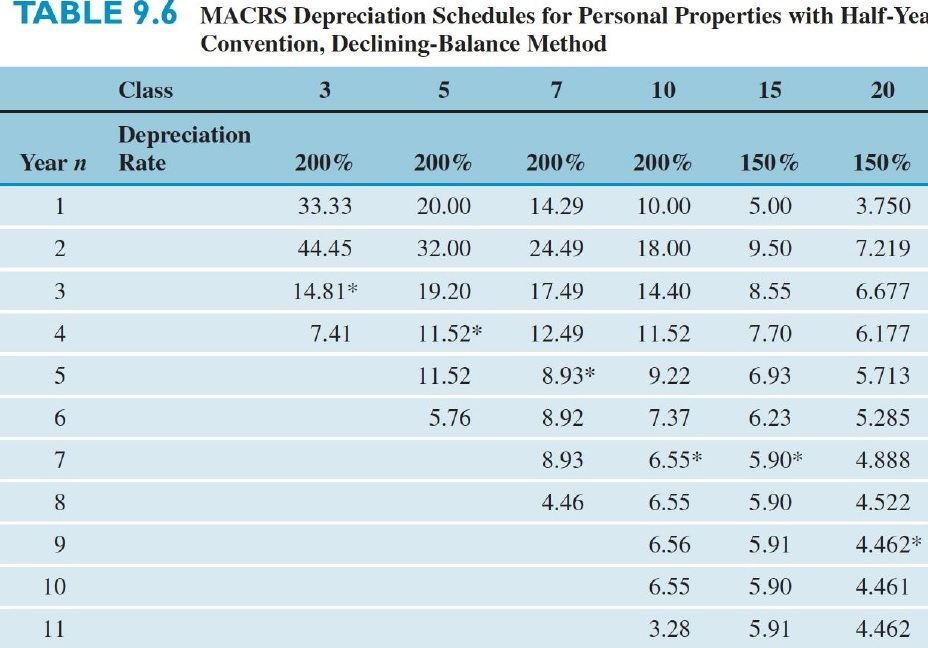
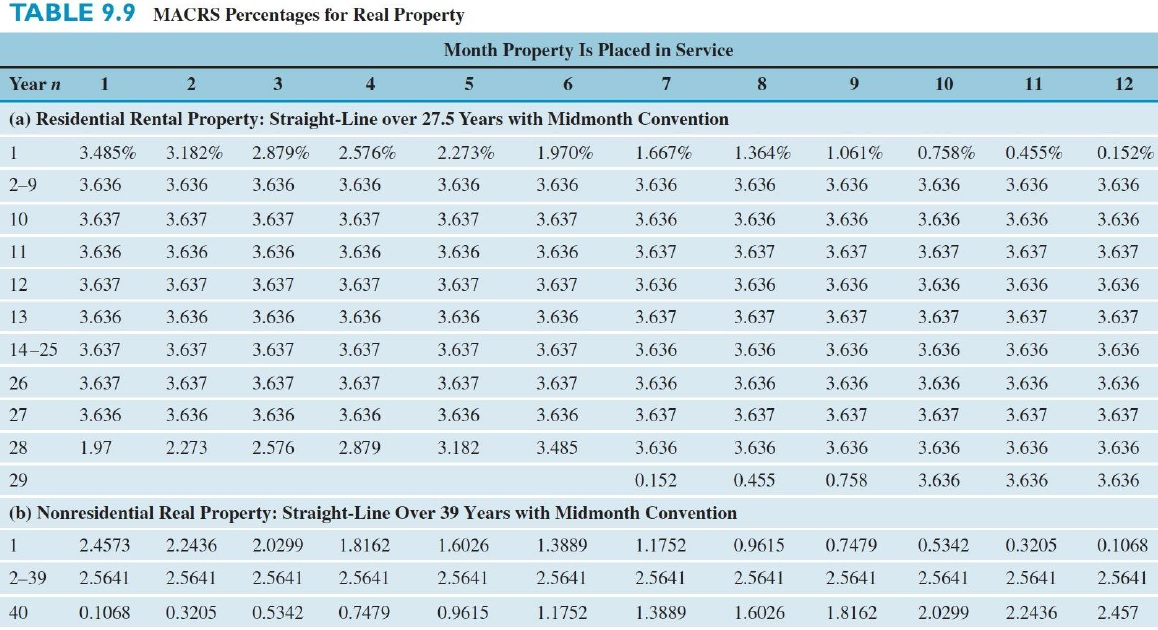
Consider the following financial information about a new machine at a computer manufacturing company: The machine costs $150,000 and will be used for 4 years. The machine will be depreciated using MACRS 5-year class property. At the end of the fourth year, the machine will be sold at 40% of the initial cost. The firm will invest $20,000 in working capital (fully recoverable at the end of the project life). The expected annual savings on labor and materials due to the new machine are $60,000 in year 1, and they will increase by $5,000 every year thereafter. Operating and maintenance costs are $22,000 annually. The firm will finance 40% of the machine money from an outside financial institution at an interest rate of 10%. The firm is required to repay the loan with 4 equal annual payments. The firm's tax rate is 40%. The firm's MARR is 15%. With the above information, compute the present worth for this project. Is this a good investment? Why? Explain your answer clearly. Show all your calculations and explain every step. Always use factor notation. Complete the income and cash flow statements. You need to submit both statements plus all the calculations involved in the numbers you introduce in these statements. Income Statement 0 2 3 4 Revenues Expenses O&M Depreciation Debt Interest Taxable income Income Taxes Net Income Cash Flow Statement 0 1 2 3 4 Operating Activities Net Income Depreciation Investment Activities Investment Salvage Value Gains Tax Working capital Financing Activities Borrowed Funds Principal Payment Net Cash Flow TABLE 9.6 MACRS Depreciation Schedules for Personal Properties with Half-Yea Convention, Declining-Balance Method Class 3 5 7 10 15 20 Depreciation Rate Year n 200% 200% 200% 200% 150% 150% 1 33.33 20.00 14.29 10.00 5.00 3.750 2 44.45 32.00 24.49 18.00 9.50 7.219 3 14.81* 19.20 17.49 14.40 8.55 6.677 4 7.41 11.52* 12.49 11.52 7.70 6.177 5 11.52 8.93* 9.22 6.93 5.713 6 5.76 8.92 7.37 6.23 5.285 7 8.93 6.55* 5.90* 4.888 8 4.46 6.55 5.90 4.522 9 6.56 5.91 4.462* 10 6.55 5.90 4.461 11 3.28 5.91 4.462 9 10 11 12 TABLE 9.9 MACRS Percentages for Real Property Month Property Is Placed in Service Year n 1 2 3 4 5 6 7 8 (a) Residential Rental Property: Straight-Line over 27.5 Years with Midmonth Convention 3.485% 3.182% 2.879% 2.576% 2.273% 1.970% 1.667% 1.364% 2-9 3.636 3.636 3.636 3.636 3.636 3.636 3.636 3.636 1.061% 0.758% 0.455% 0.152% 3.636 3.636 3.636 3.636 10 3.637 3.637 3.637 3.637 3.637 3.637 3.636 3.636 3.636 3.636 3.636 3.636 11 3.636 3.636 3.636 3.636 3.636 3.636 3.637 3.637 3.637 3.637 3.637 3.637 12 3.637 3.637 3.637 3.637 3.637 3.637 3.636 3.636 3.636 3.636 3.636 3.636 13 3.636 3.636 3.636 3.636 3.636 3.636 3.637 3.637 3.637 3.637 3.637 3.637 14-25 3.637 3.637 3.637 3.637 3.637 3.637 3.636 3.636 3.636 3.636 3.636 3.636 26 3.637 3.637 3.637 3.637 3.637 3.637 3.636 3.636 3.636 3.636 3.636 3.636 27 3.636 3.636 3.636 3.636 3.636 3.636 3.637 3.637 3.637 3.637 3.637 3.637 28 1.97 2.273 2.576 2.879 3.182 3.485 3.636 3.636 3.636 3.636 3.636 3.636 0.758 3.636 3.636 3.636 29 0.152 0.455 (b) Nonresidential Real Property: Straight-Line Over 39 Years with Midmonth Convention 2.4573 2.2436 2.0299 1.8162 1.6026 1.3889 1.1752 0.9615 2-39 2.5641 2.5641 2.5641 2.5641 2.5641 2.5641 2.5641 2.5641 1 0.7479 0.5342 0.3205 0.1068 2.5641 2.5641 2.5641 2.5641 40 0.1068 0.3205 0.5342 0.7479 0.9615 1.1752 1.3889 1.6026 1.8162 2.0299 2.2436 2.457


