

Question
Consider the following forecasts of returns on two risky assets (r 1 and r2), risk-free asset (r f ), and the market (r M ):
Consider the following forecasts of returns on two risky assets (r1 and r2), risk-free asset (rf), and the market (rM):
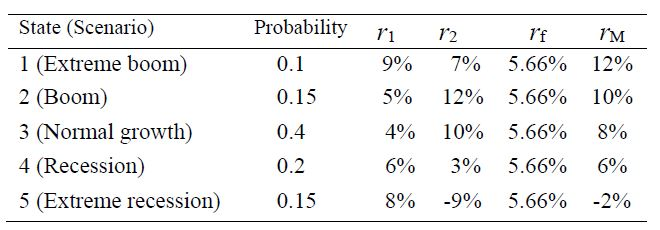
Compute and report the CML equation. Next, compute the expected returns predicted by the CML for securities 1 and 2. Produce a graph (Graph 2) containing the CML and the two securities and indicate where each of the securities is located relative to the CML. Finally, for each security report whether it is efficient.
Probability T12 State (Scenario) 1 (Extreme boom) 2 (Boom) 3 (Normal growth) 4 (Recession) 5 (Extreme recession)0.15 0.1 0.15 0.4 0.2 9% 5% 4% 6% 8% 7% 12% 10% 300 -9% If 5.66% 5.66% 5.66% 5.66% 5.66% TM 12% 10% 8% 6% -2%
Step by Step Solution
There are 3 Steps involved in it
Step: 1

Get Instant Access to Expert-Tailored Solutions
See step-by-step solutions with expert insights and AI powered tools for academic success
Step: 2

Step: 3
Ace Your Homework with AI
Get the answers you need in no time with our AI-driven, step-by-step assistance
Get Started
Asset Management And Institutional Investors
Authors: Ignazio Basile, Pierpaolo Ferrari
1st Edition
331932795X,3319327968