Answered step by step
Verified Expert Solution
Question
1 Approved Answer
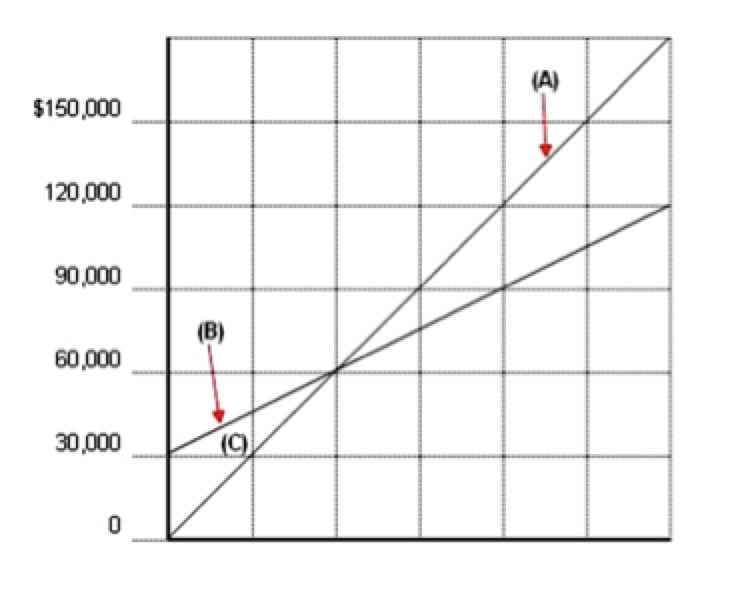
Consider the following graph. 1. What does line A represent? 2. What does line B represent? 3. What does area C represent? 4. What amount
Consider the following graph.

1. What does line A represent?
2. What does line B represent?
3. What does area C represent?
4. What amount is $30,000?
A. Loss (Not profitable) B. Total Revenue C. Variable Costs D. Profitable Area E. Break-Even Point F. Total Costs G. None of these H. Fixed Costs
$150,000 120,000 90,000 60,000 30,000Step by Step Solution
There are 3 Steps involved in it
Step: 1

Get Instant Access to Expert-Tailored Solutions
See step-by-step solutions with expert insights and AI powered tools for academic success
Step: 2

Step: 3

Ace Your Homework with AI
Get the answers you need in no time with our AI-driven, step-by-step assistance
Get Started


