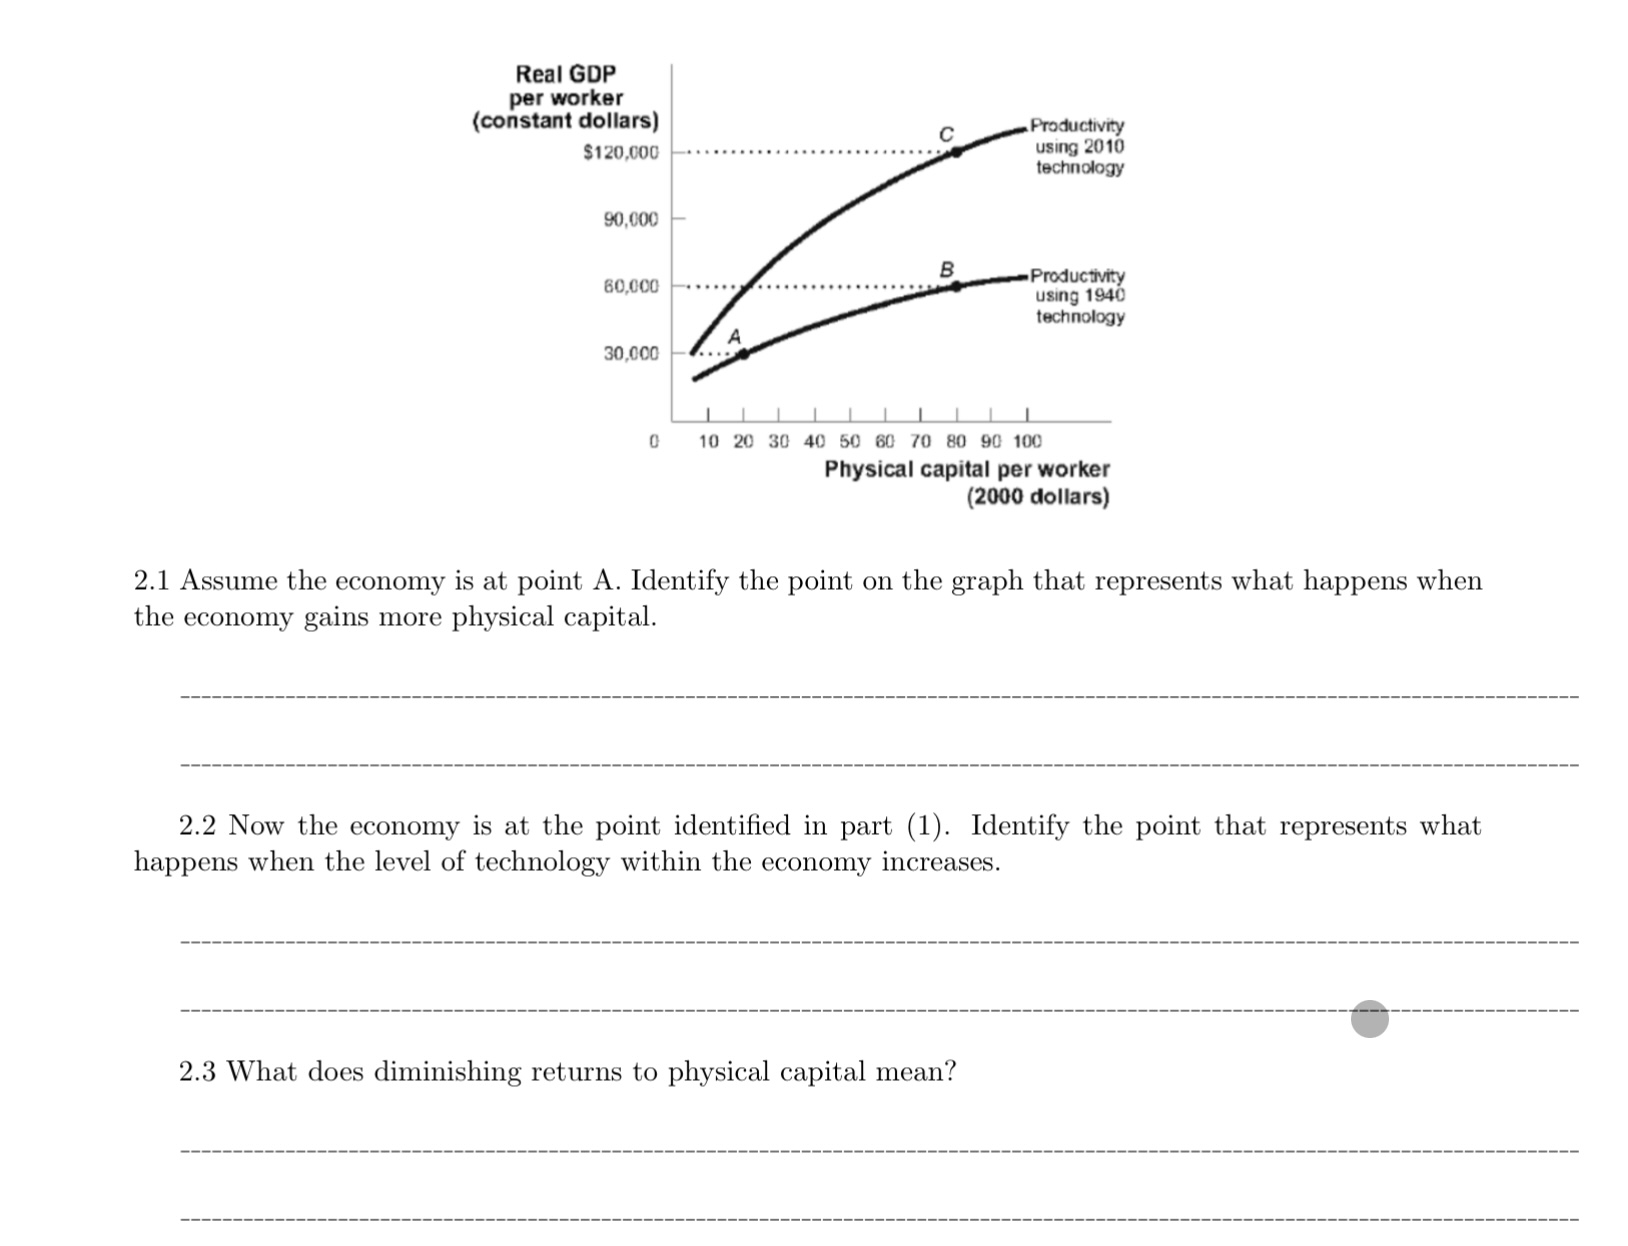
Consider the following graph of the aggregate production function Real GDP per worker (constant dollars) $120,000 90,000 60,000 30,000 B Productivity using 2010 technology Productivity
Consider the following graph of the aggregate production function

Real GDP per worker (constant dollars) $120,000 90,000 60,000 30,000 B Productivity using 2010 technology Productivity using 1940 technology 0 10 20 30 40 50 60 70 80 90 100 Physical capital per worker (2000 dollars) 2.1 Assume the economy is at point A. Identify the point on the graph that represents what happens when the economy gains more physical capital. 2.3 What does diminishing returns to physical capital mean? 2.2 Now the economy is at the point identified in part (1). Identify the point that represents what happens when the level of technology within the economy increases.
Step by Step Solution
There are 3 Steps involved in it
Step: 1
1 What is the economy at point A B C D E F G H I and J The points on the graph represent different levels of productivity for a given level of physica...
See step-by-step solutions with expert insights and AI powered tools for academic success
Step: 2

Step: 3

Ace Your Homework with AI
Get the answers you need in no time with our AI-driven, step-by-step assistance
Get Started


